
|
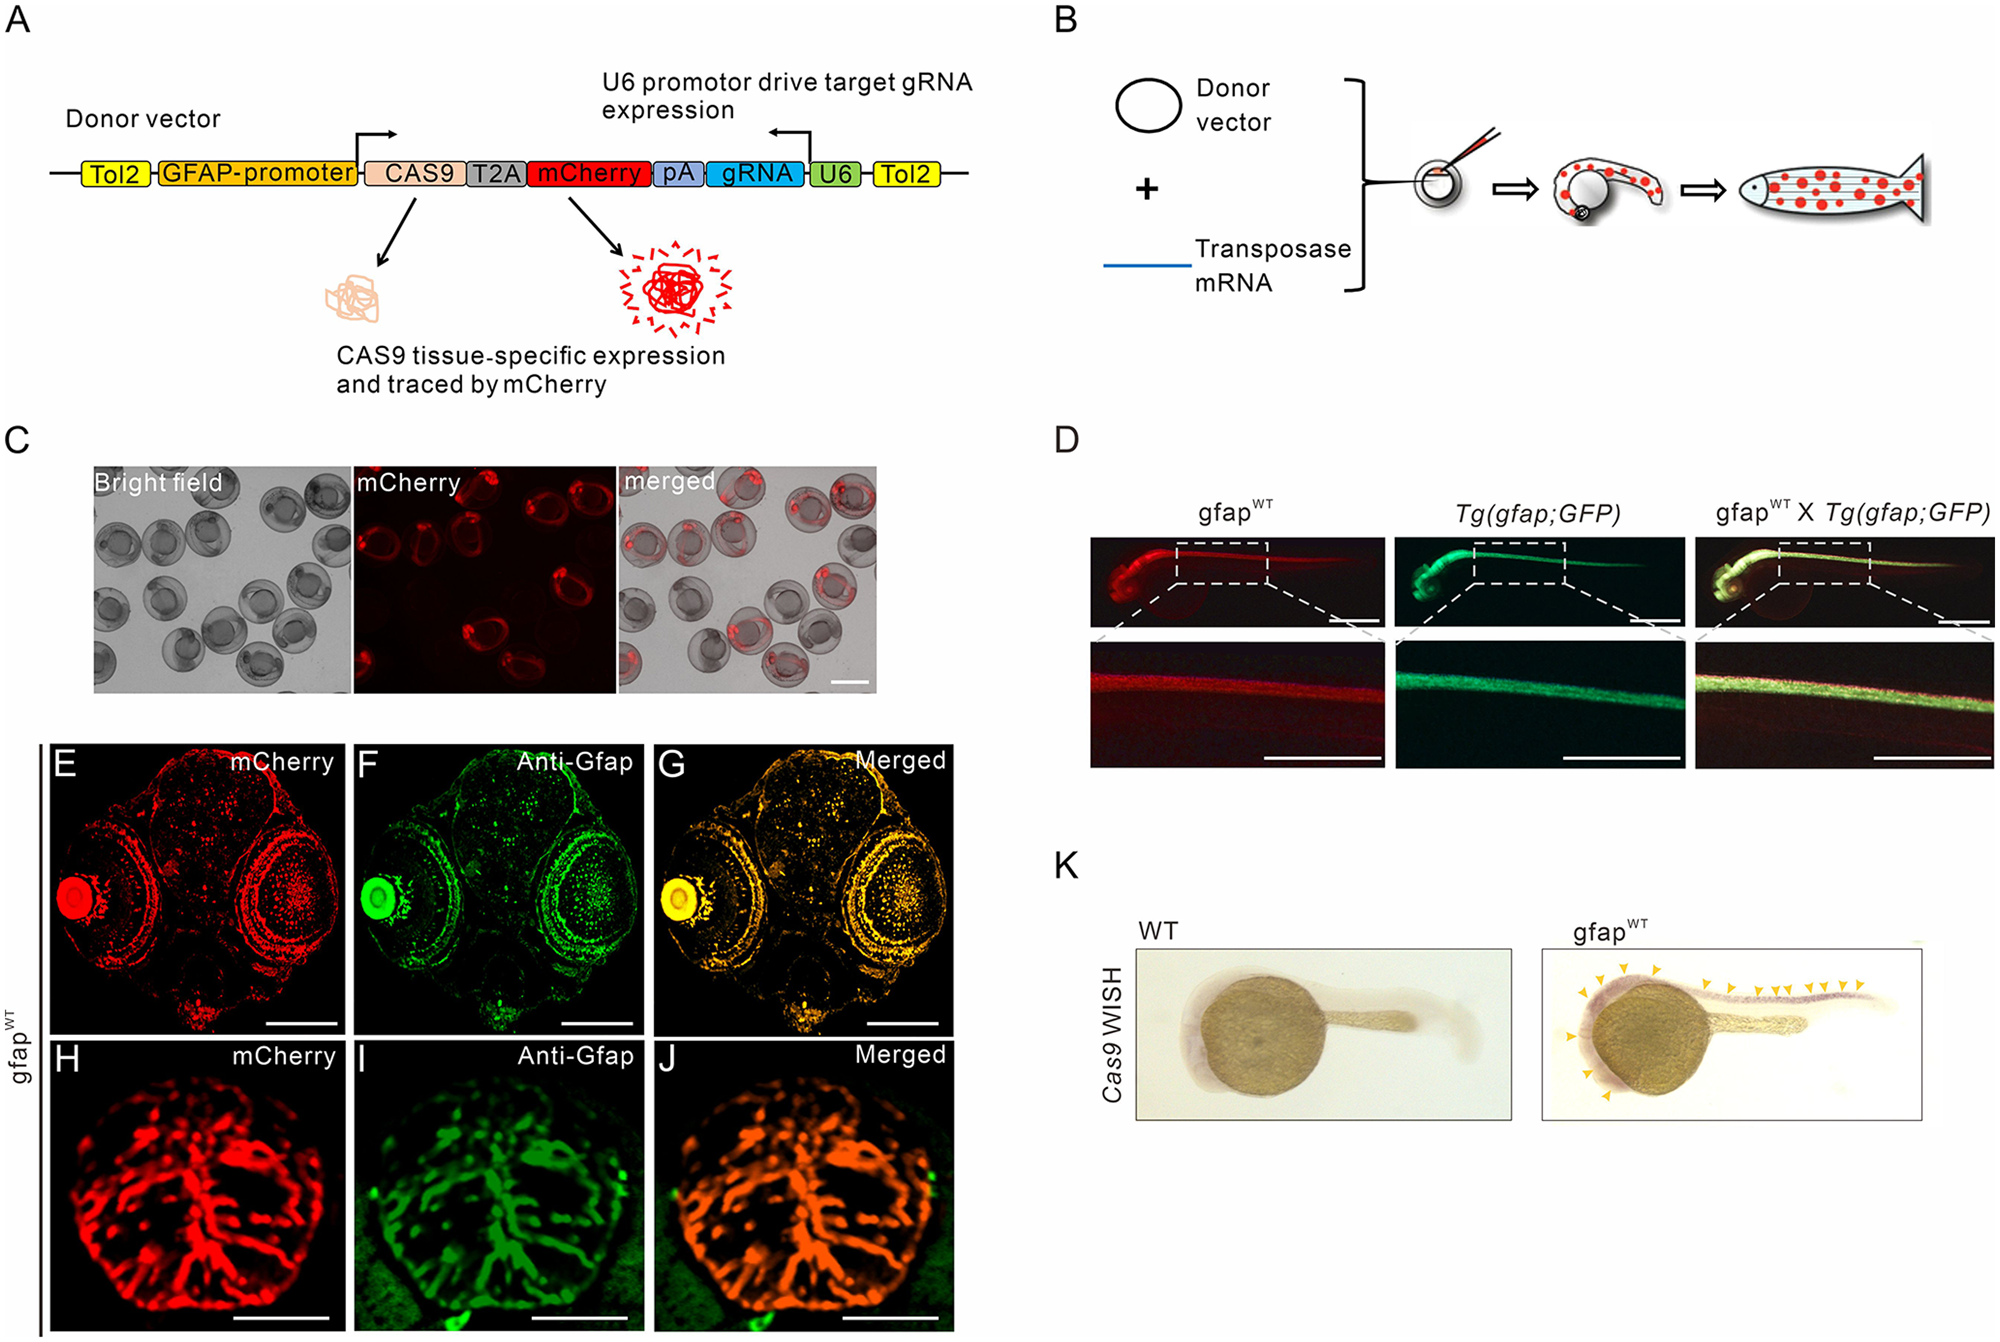
Fig. 1 CRISPR/Cas9-based deletion system in zebrafish. (A) Schematic illustration of the constructs of the CRISPR/Cas9-based vector, including the gfap promoter-driving Cas9, mCherry reporter, and U6-driving specific gRNA. (B) Strategy of the generation of the transgenic zebrafish lines. (C) F1 transgenic fish generated by mosaic mCherry-positive fish outcrossed with wild-type fish. A subset of the transgenic offspring was identified by mCherry-positive astrocytes. Scale bar = 1 mm. (D) The colocalization of mCherry-labelled Cas9 and GFP-labelled endogenous Gfap in 60 hpf offspring from the cross of gfapWT and Tg(gfap:GFP) transgenic fish. Scale bars = 500 μm. (E–J) Co-localization of mCherry fluorescent signals (red) and endogenous Gfap detected by anti-Gfap antibody (FITC; green) in the brain and retina (E–G) or spinal cord (H–J) tissue. Scale bars = 200 μm. (K) Representative images of whole-mount in situ hybridization using an anti-sense RNA probe against Cas9 mRNA in 48 hpf embryos injected with Tol2 mRNA and gfap:Cas9-T2A-mCherry,U6:gRNA(null) vector expressing Cas9 under the control of the gfap promoter. Cas9 expression pattern is governed by the tissue-specificity of gfap promoter (yellow arrowheads). Scale bars = 500 μm.