
Fig. 4
- ID
- ZDB-IMAGE-210413-31
- Genes
- Antibodies
- Publication
- Weinreb et al., 2021 - Excessive R-loops trigger an inflammatory cascade leading to increased HSPC production
- All Figures
- Figures for Weinreb et al., 2021
|
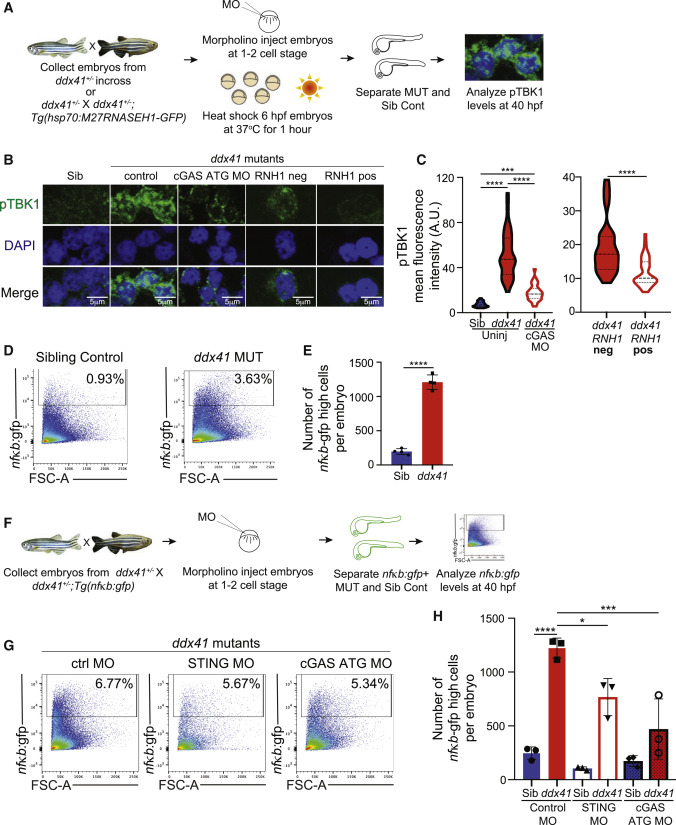
Fig. 4 Ddx41 regulates inflammatory signaling via the cGAS-STING pathway (A) Schematic of the Ser172-phosphorylated TBK1 (pTBK1) immunofluorescence experiments. (B) Confocal images showing immunofluorescence of pTBK1 and nuclei (DAPI) in cells isolated from 40 hpf siblings, ddx41 mutants (control), ddx41 mutants injected with cGAS translation-blocking (ATG) MO, RNH1-negative ddx41 mutants and RNH1-positive ddx41 mutants. Scale bar, 5 μm. (C) Quantification of pTBK1 levels from (B). (D) Flow cytometry plots of NFκB:gfp+ cells from sibling controls (left) and ddx41 mutants (right) at 40 hpf. (E) Graph depicting the absolute number of NFκB:gfp-high cells per embryo shown in (D). (F) Schematic of the cGAS-STING pathway knockdown experiments with NFκB:gfp quantification. (G) Flow cytometry plots of NFκB:gfp+ cells from ddx41 mutants injected with control morpholino (left), splice-blocking sting morpholino (middle), or cgas ATG morpholino (right) at 40 hpf. (H) Graph depicting the absolute number of NFκB:gfp-high cells per embryo shown in (G). Graphs display means ± stds with p values calculated with unpaired Student’s t test (E) or a one-way ANOVA with Tukey’s multiple testing correction (C and H), ∗p < 0.05, ∗∗∗p < 0.001, ∗∗∗∗p < 0.0001. N = 3–5 replicates per experiment.
Reprinted from Developmental Cell, 56(5), Weinreb, J.T., Ghazale, N., Pradhan, K., Gupta, V., Potts, K.S., Tricomi, B., Daniels, N.J., Padgett, R.A., De Oliveira, S., Verma, A., Bowman, T.V., Excessive R-loops trigger an inflammatory cascade leading to increased HSPC production, 627-640.e5, Copyright (2021) with permission from Elsevier. Full text @ Dev. Cell