
|
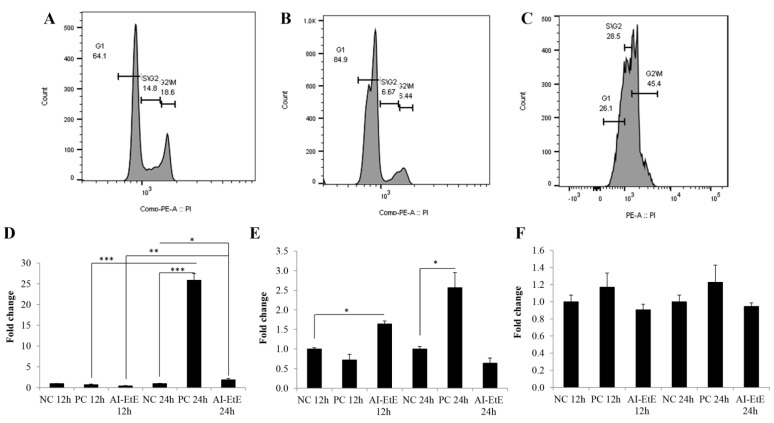
Figure 6 HeLa cells were treated with DMSO (negative control), AI-EtE at IC50 dose of 38.8 mg/L or paclitaxel (positive control) at IC50 dose of 13.5 ng/mL for 24 h before collecting, fixing, staining with propidium iodide and subjecting to flow cytometry system to measure of cellular DNA content. Representative data sets of cell cycle pattern of HeLa cells upon DMSO treatment (A), AI-EtE treatment (B), and paclitaxel treatment (C) were presented. Transcript levels of CDKN1A (D), CDKN2A (E) and p53 (F) in HeLa cells treated with AI-EtE and paclitaxel for 12 h and 24 h. *, ** and ***, significant differences with p values <0.05, <0.01 and <0.001, respectively. TBP was used as internal control gene. NC: negative control, PC: positive control (paclitaxel).