
|
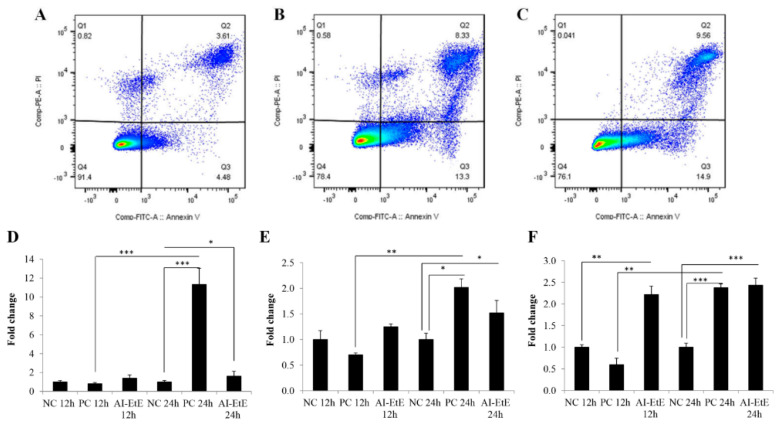
Figure 5 HeLa cells were treated with DMSO (negative control), AI-EtE at IC50 dose of 38.8 mg/L or paclitaxel (positive control) at IC50 dose of 13.5 ng/mL for 24 h before collecting, fixing, staining with propidium iodide (PI)/annexin V-FITC and subjecting to flow cytometry system to measure of apoptosis. Representative data sets of apoptotic pattern of HeLa cells upon DMSO treatment (A), AI-EtE treatment (B), and paclitaxel treatment (C) are presented. Transcript levels of BAX (D), CASPASE-8 (E), CASPASE-3 (F) in HeLa cells treated with AI-EtE and paclitaxel for 12 h and 24 h. *, ** and ***, significant differences with p values < 0.05, <0.01 and <0.001, respectively. TBP was used as internal control gene. NC: negative control, PC: positive control (paclitaxel).