
Image
|
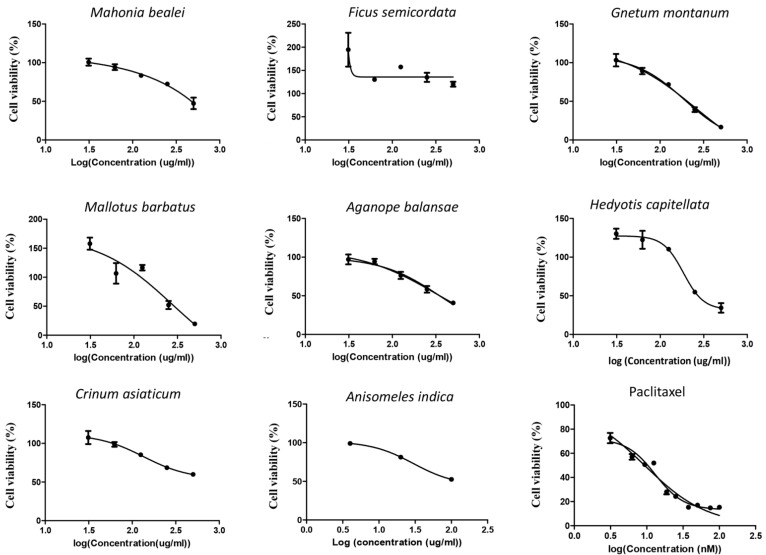
Figure Caption
Figure 3 The MCF-7 cells were treated with the extracts at various concentrations of 1, 5, 10, 50, 100, 250, 500 and 1000 µg/mL. The toxicity curves of the ethanol extracts of Mahonia bealei, Ficus semicordata, Gnetum montanum, Crinum asiaticum, Mallotus barbatus, Aganope balansae, Hedyotis capitellata, Anisomeles indica and Paclitaxel were presented. The cell viability is shown as % relative to untreated control. The curves were drawn by using GraphPad prism software.
Acknowledgments
This image is the copyrighted work of the attributed author or publisher, and
ZFIN has permission only to display this image to its users.
Additional permissions should be obtained from the applicable author or publisher of the image.
Full text @ Life (Basel)