
Figure 3
- ID
- ZDB-IMAGE-210409-18
- Publication
- Haege et al., 2021 - Identification of Lactate as a Cardiac Protectant by Inhibiting Inflammation and Cardiac Hypertrophy Using a Zebrafish Acute Heart Failure Model
- All Figures
- Figures for Haege et al., 2021
|
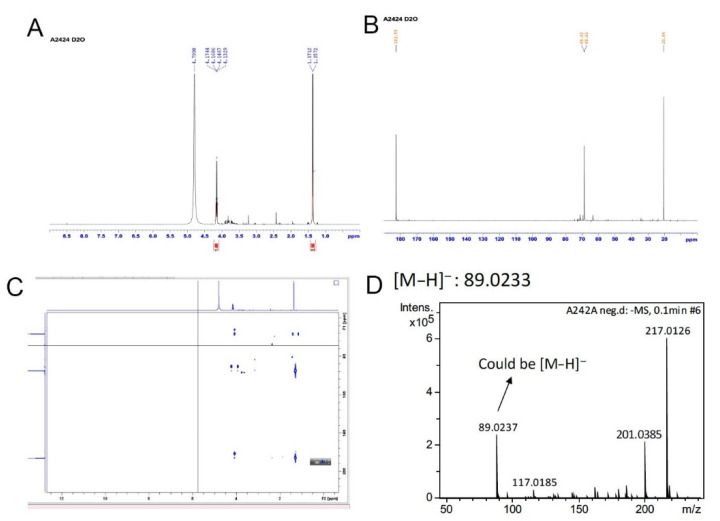
Figure 3 Chemical analyses for A2-4-2-4. A2-4-2-4 was analyzed using NMR and ESIMS. (A) The 1H-NMR graph indicates a methyl group (δH 1.3, d, J = 7.0 Hz) and a methane group (δH 4.16, q, J = 7.0 Hz) in A2-4-2-4. (B) The 13C-NMR indicates a carboxyl group (δC 182.5), a hydroxyl group (δH 68.6), and a methyl group (δH 20.4) in the major compound in A2-4-2-4. (C) The 2-dimensional NMR, using heteronuclear multiple bond correlation, further confirmed that the major compound in A2-4-2-4 is lactate. (D) ESIMS analysis revealed that the molecular weight of the major compound in A2-4-2-4 is 89.0233 (C3H6O3).