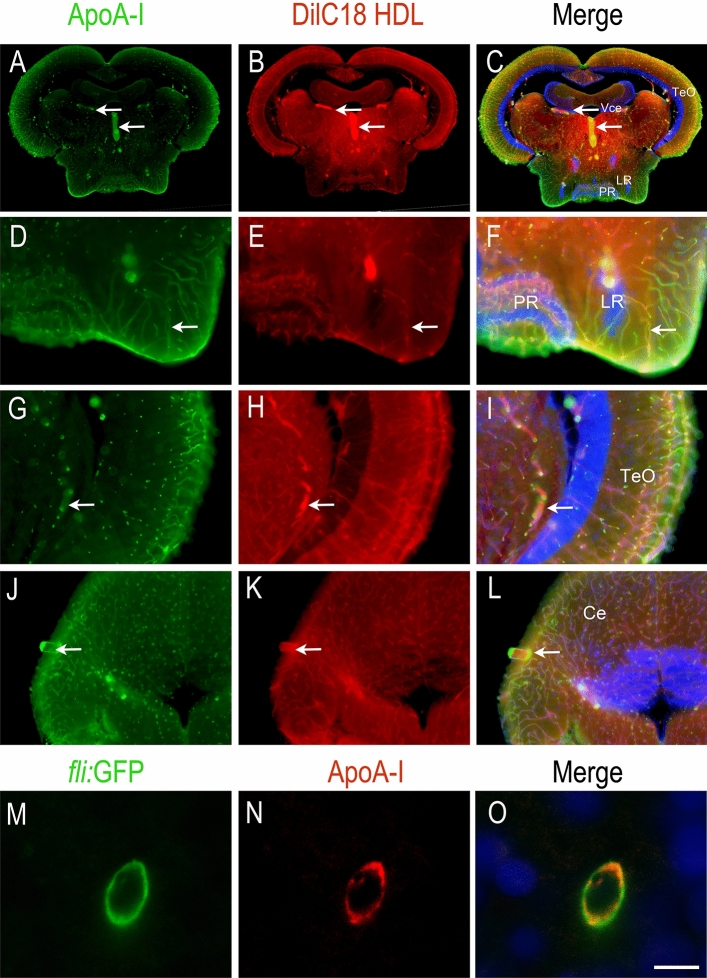
IMAGE

Figure 5

ID
ZDB-IMAGE-210327-13
Source
Figures for Sulliman et al., 2021
Image
Figure Caption

Figure 5

HDLs reach the brain microvasculature in zebrafish. ApoA-I immunohistochemistry (green) on zebrafish brain Sects. 1 h 30 min after intraperitoneal injection with 80 mg/kg of fluorescent HDL particles (red). Note that similar data were obtained with HDLs isolated from plasma (plHDL, n = 3) and with reconstituted HDLs (rHDL, n = 7). (AL) ApoA-I staining (green) colocalizes with fluorescent HDLs (red) as clearly evidenced by the merged pictures and revealed blood vessel staining. (MO) Confocal imaging of a transverse brain section from a Tg(fli1:EGFP) zebrafish expressing GFP in the endothelial cells from blood vessels54. Note ApoA-I staining (red) detection in endothelial cells (green). The merge pictures (C, F, I, L, O) also show cell nuclei using DAPI counterstaining (blue). Scale bar = 50 μm.

Acknowledgments
This image is the copyrighted work of the attributed author or publisher, and ZFIN has permission only to display this image to its users. Additional permissions should be obtained from the applicable author or publisher of the image. Full text @ Sci. Rep.