
|
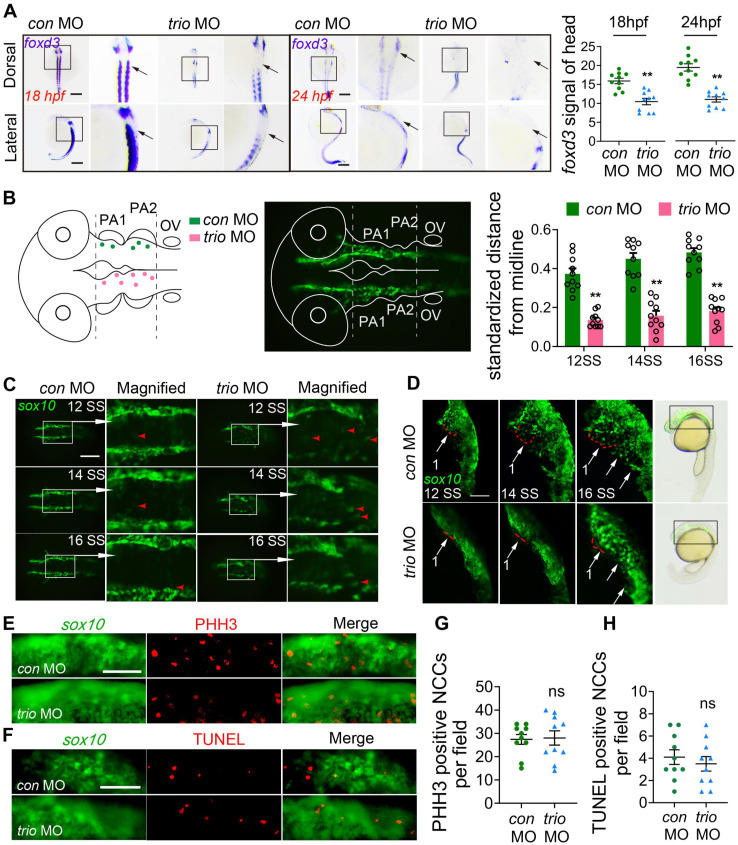
Figure 2 trio morphants show disruption of NCC migration. (A) WISH was performed for the NCC migration marker foxd3 in con MO and trio MO zebrafish embryos. The dorsal and lateral views of 18 hpf and 24 hpf embryos show foxd3 expression in cranial NCC migratory streams (black arrow). Bar = 200 μm. Quantification of the foxd3 mRNA signal detected in control or trio morphant embryos at 18 hpf or 24 hpf (n = 10). (B) Schematic of cranial NCC clusters distribution in the dorsal neural tube region surrounded by two dotted lines in the con MO and trio MO Tg(sox10:egfp) embryos from 12 SS to 16SS. The dots represent centroids of cell clusters, which are defined as two or more cells in contact with each other. Green dots above the midline represents con MO specimens, pink dots below the midline represents trio MO specimen. The middle schematic showed the study area in the fluorescence field. Normalized distances of centroids clusters from the midline in embryos at 12, 14, 16 SS were accounted for studying NCC migration tendency (n = 10). (C) Dorsal view of time-lapse images of con MO and trio MO Tg(sox10:egfp) live zebrafish embryos at 12, 14, and 16 SS. (The white frame highlights the NCCs in the area, while the red arrowhead denoting GFP-positive NCCs). The magnified images show NCCs in trio morphants appearing in the dorsal midline. Bar = 500 μm. NCCs: neural crest cells; SS: somite stage. (D) Lateral view of time-lapse images of con MO and trio MO Tg(sox10:egfp) embryos at 12, 14, 16 SS. The red dotted lines outline the first NCC migratory stream. The white arrows indicate the cranial NCC migratory streams. Bar = 250 μm. Bright field schematics show the location of green fluorescence at 21 hpf. MO: morpholino. (E) PHH3 staining of con MO and trio MO embryos indicates cranial NCC proliferation at 10 SS. Bar = 500 μm. PHH3: phosphohistone H3. (F) TUNEL staining of con MO and trio MO embryos indicates cranial NCC apoptosis at 10 SS. Bar = 500 μm. TUNEL: terminal deoxynucleotidyl transferase dUTP nick end labeling. (G, H) Quantitative analysis of PHH3 and TUNEL positive NCCs in the cranial region in (E) and (F). For (A), (B), (G) and (H), data are represented as mean ± S.E.M. (two-tailed t test **p < 0.01, ns, not significant).