
|
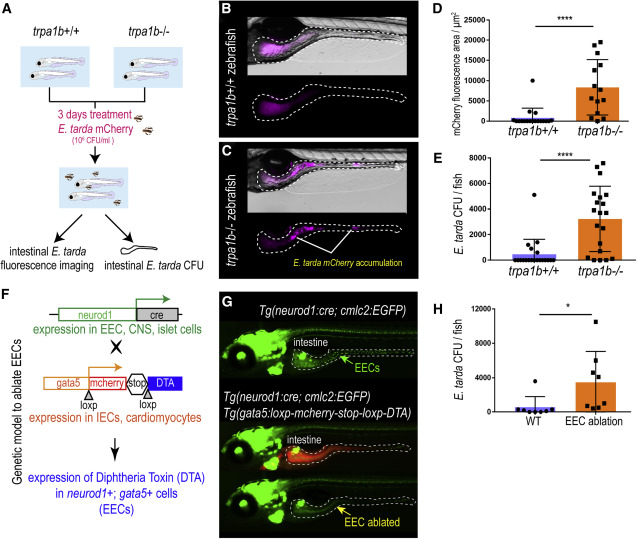
Fig. 3 Figure 3. Activation of EEC Trpa1 signaling facilitates enteric E. tarda clearance (A) Schematic of zebrafish E. tarda treatment. (B and C) Representative image of trpa1b+/+ (B) or trpa1b−/− (C) zebrafish treated with E. tarda expressing mCherry (E. tarda mCherry). (D) Quantification of E. tarda mCherry fluorescence in trpa1b+/+ or trpa1b−/− zebrafish intestine. (E) Quantification of intestinal E. tarda CFU in trpa1b+/+ or trpa1b−/− zebrafish. (F) Schematic of a genetic model in which EECs are ablated via Cre-induced Diphtheria Toxin (DTA) expression. (G) Representative image of Tg(neurod1:cre; cmlc2:EGFP) and Tg(neurod1:cre; cmlc2:EGFP); TgBAC(gata5:RSD) with EECs that are labeled by Tg(neurod1:EGFP). (H) Quantification of intestinal E. tarda CFU in WT or EEC-ablated zebrafish. Student’s t test was used in (D, E, and H). ∗p < 0.05; ∗∗∗∗p < 0.0001.