
Fig. 1
- ID
- ZDB-IMAGE-210324-28
- Publication
- Olguin-Olguin et al., 2021 - Chemokine-biased robust self-organizing polarization of migrating cells in vivo
- All Figures
- Figures for Olguin-Olguin et al., 2021
|
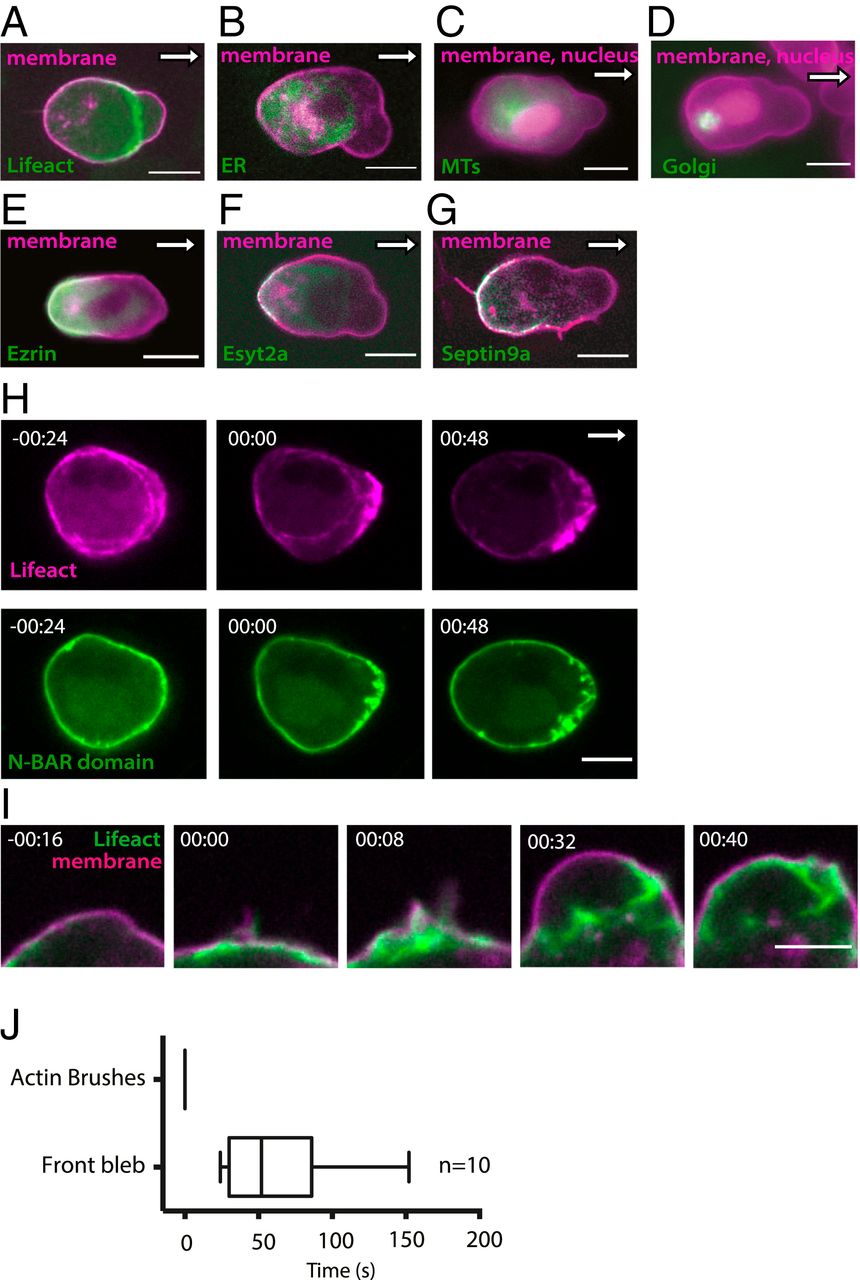
Fig. 1 Polarized distribution of proteins and subcellular structures within wild-type migrating PGCs and steps of self-organized ligand-independent polarized bleb formation. (A–G) The localization fluorescent protein fusions (green) labeling (A) actin (Lifeact), (B) the ER (calreticulin signal peptide), (C) the MTs (Clip-170H protein), (D) the Golgi (N terminus of beta 1,4-galactosyltransferase fusion), (E) Ezrin, (F) extended synaptotagmin-like 2a (Esyt2a) and (G) Septin9a, relative to the plasma membrane (labeled by a farnesylation signal from c-Ha-Ras fused to fluorescent protein [magenta]) and the nucleus (magenta in C and D). White arrows indicate the direction of migration. (Scale bars, 10 µm.) (H) The formation of membrane invaginations labeled with the N-BAR domain (human Amphiphysin fused to YFP [green]), at the new front where Lifeact-labeled actin accumulates (magenta). Times are in minutes and seconds. (Scale bar, 10 µm.) (I) The formation of actin brushes at the new front and inflation of the first bleb. Times are in minutes and seconds. (Scale bar, 5 µm.) (J) The time of bleb formation relative to the time of establishment of actin brushes at the cell front (median, 5 and 95 percentiles are indicated. n = number of cells, time is in seconds).