IMAGE

FIGURE 2

ID
ZDB-IMAGE-210324-25
Source
Figures for Ross et al., 2021
Image
Figure Caption

FIGURE 2

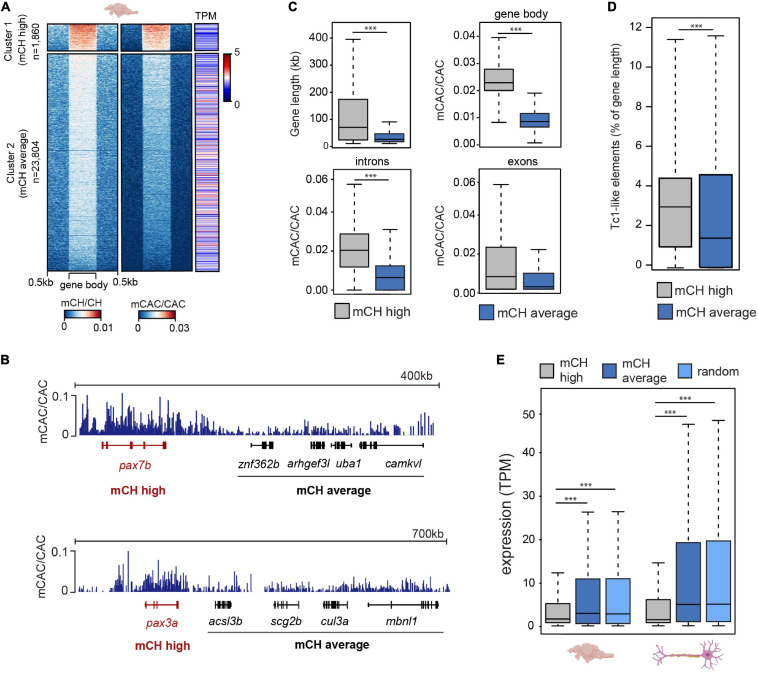
mCH is present at long genes with low expression levels. (A) mCH/CH levels, mCAC/CAC levels, and gene expression represented as transcripts per million (TPM) in adult zebrafish brains. (B) Genome browser snapshot of mCAC/CAC levels in cluster 1 (red) and cluster 2 (black) genes in adult brains. (C) Comparisons of gene length (top left), average gene mCAC/CAC (top right), average exon mCAC/CAC (bottom left) and average intron mCAC/CAC (bottom right) in genes with high (cluster 1) and moderate/low levels of mCAC/CAC (cluster 2) (Wilcoxon test, ∗∗∗P < 0.001). (D) Tc1-like element percentage of total gene length in genes with high (cluster 1) and moderate/low levels of mCAC/CAC (cluster 2) (Wilcoxon test, ∗∗∗P < 0.001). (E) Average expression levels (TPM) in 6-month old brains (n = 5) and neurons (n = 30) at genes with high (cluster 1), or moderate/low (cluster 2) mCH, and a random subset of genes (n = 1,860) sampled from cluster 2 (Wilcoxon test, ∗∗∗P < 0.001).

Acknowledgments
This image is the copyrighted work of the attributed author or publisher, and ZFIN has permission only to display this image to its users. Additional permissions should be obtained from the applicable author or publisher of the image. Full text @ Front Cell Dev Biol