
|
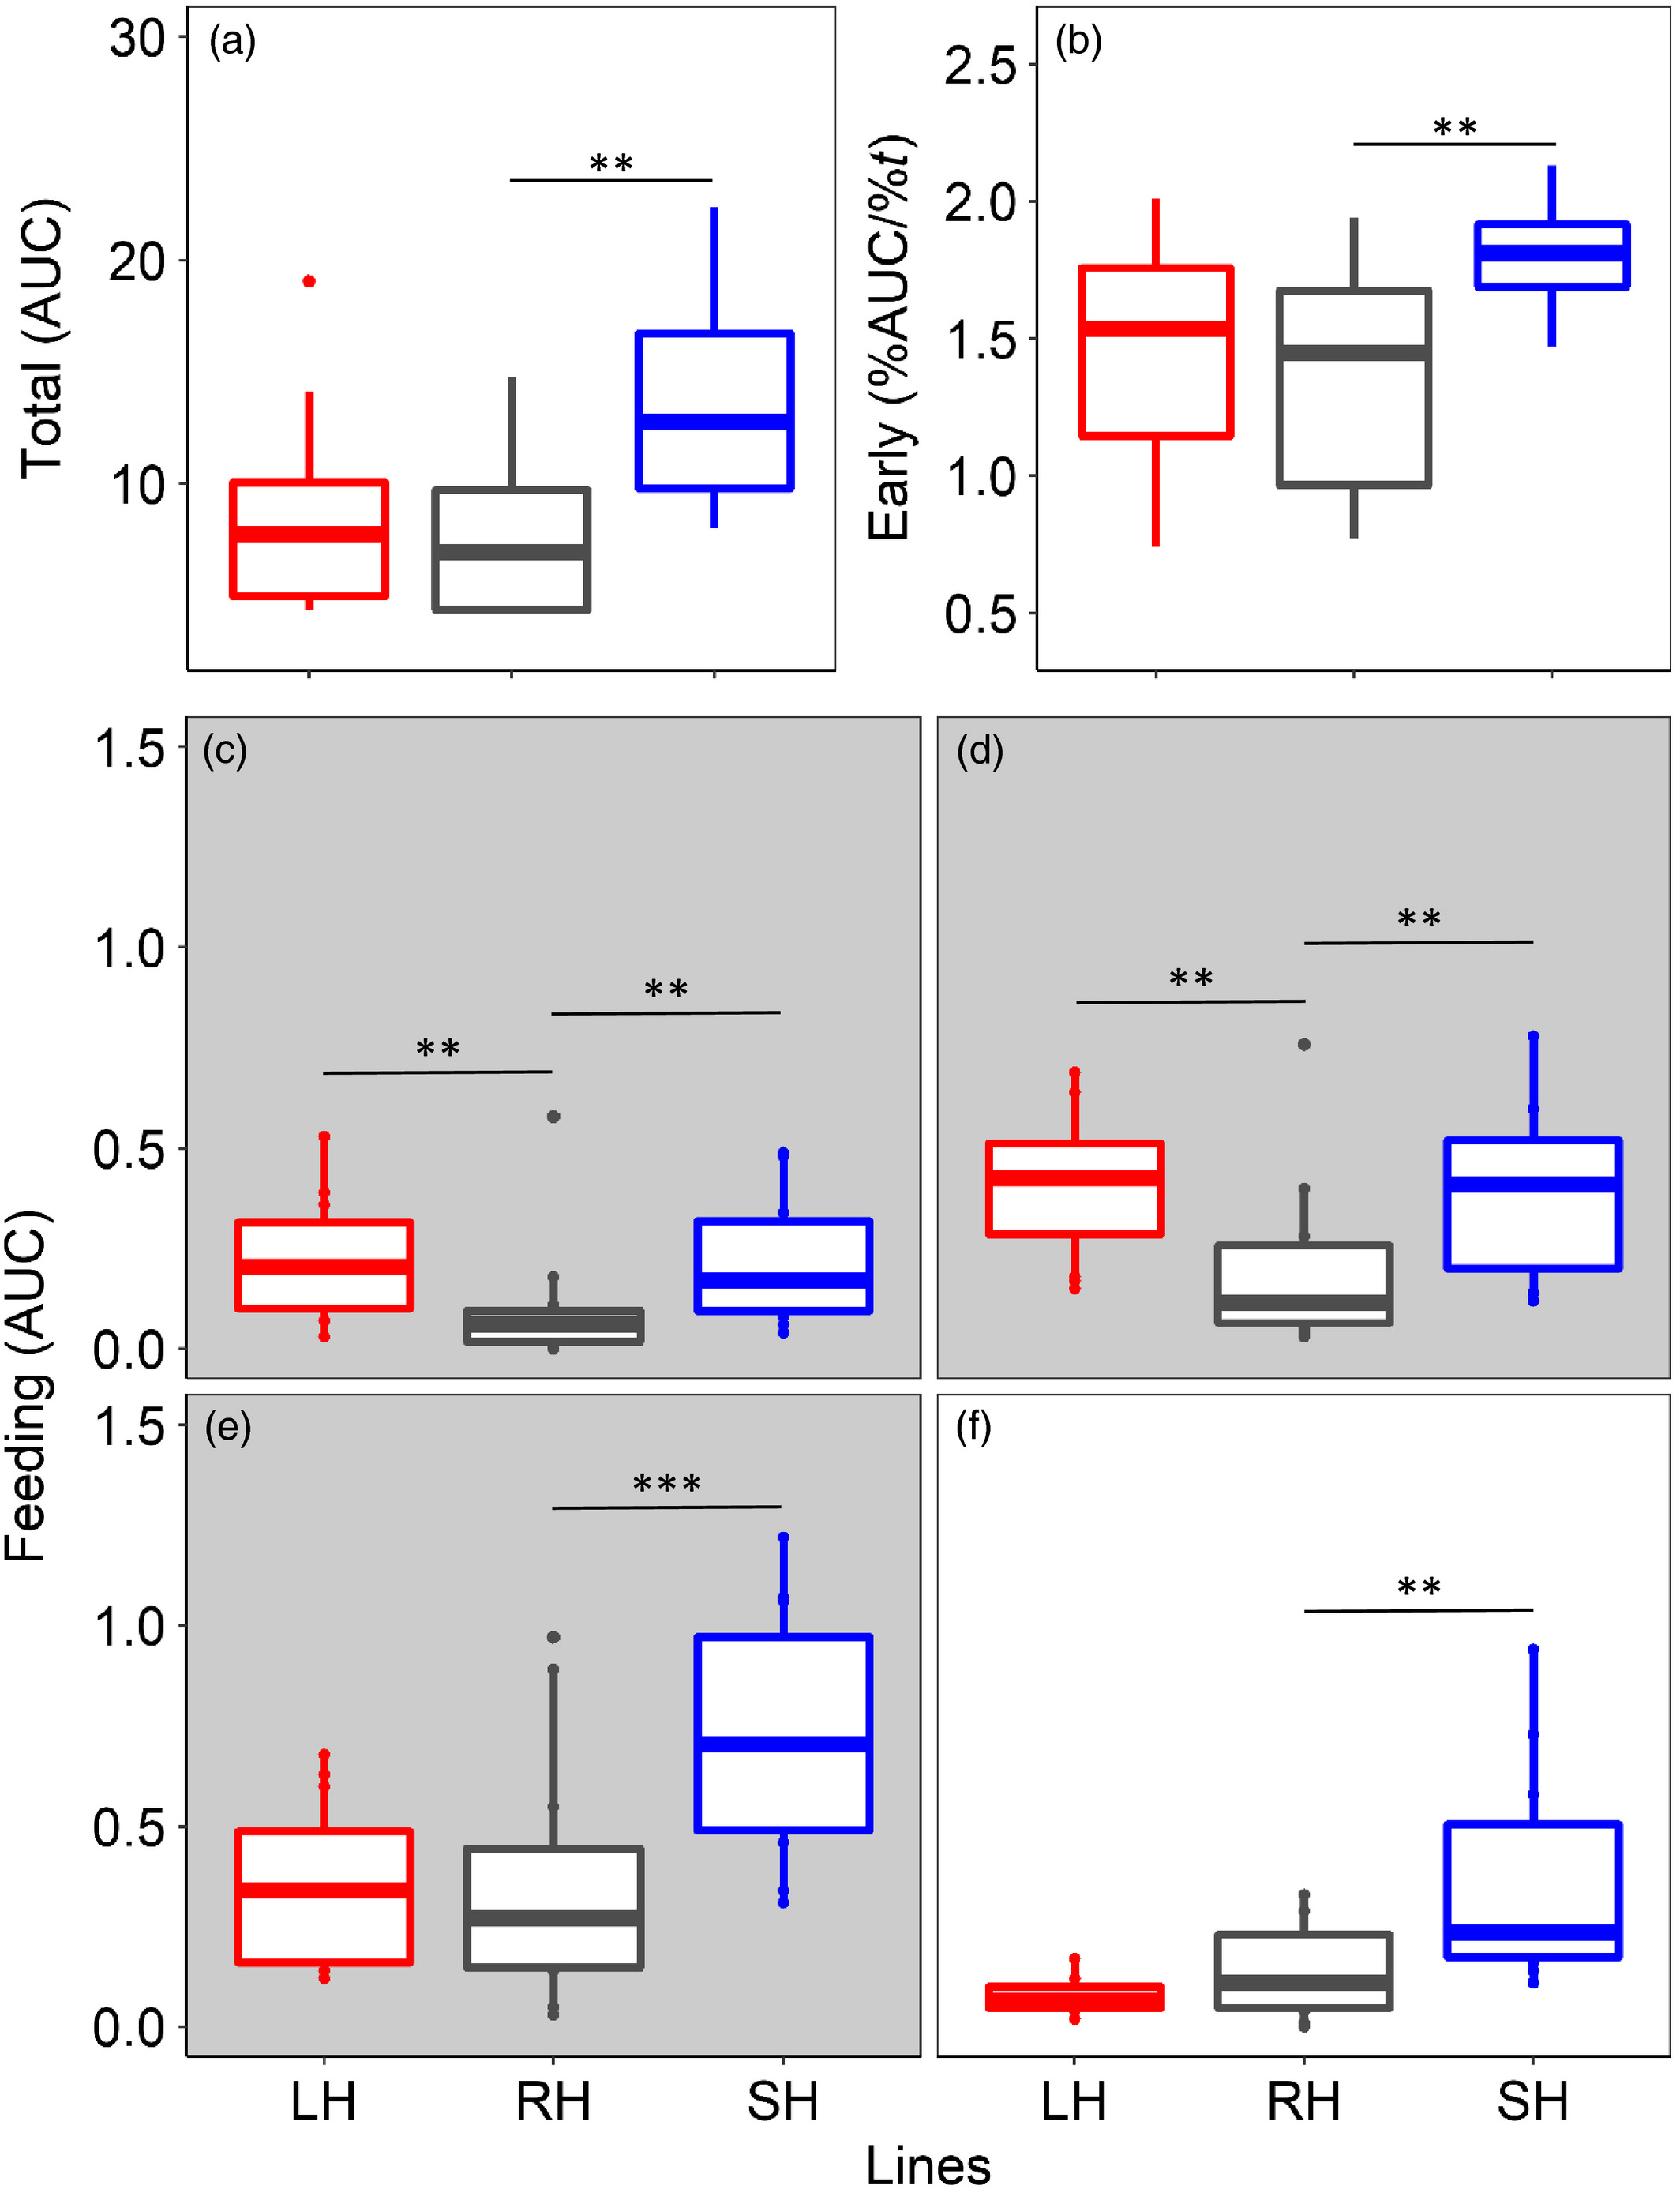
Fig. 4 Total swimming activity during light hours (a; area under the waveform curve, AUC) and early daily activity (b; percentage of activity during the first 4 hr of light) together with self‐feeding activity (c–f; area under the waveform curve, AUC) during the last 3 hr of scotophase (grey shadow; c = 06:00–07:00; d = 07:00–08:00; e = 08:00–09:00) and the first hour of photophase (f = 09:00–10:00). The different colours represent the selection lines: red for large‐harvested (LH) grey for control (RH) and blue for small‐harvested (SH); N between 5 and 6 (see Table 1 for more details). Boxplots represent the median (bold centreline), the 25th (top of the box) and 75th percentile (bottom of the box). Significant differences are indicated by black horizontal lines (**p < 0.01; ***p < 0.001; see text for more details)