IMAGE

FIGURE 5

ID
ZDB-IMAGE-210319-61
Source
Figures for Lai et al., 2021
Image
Figure Caption

FIGURE 5

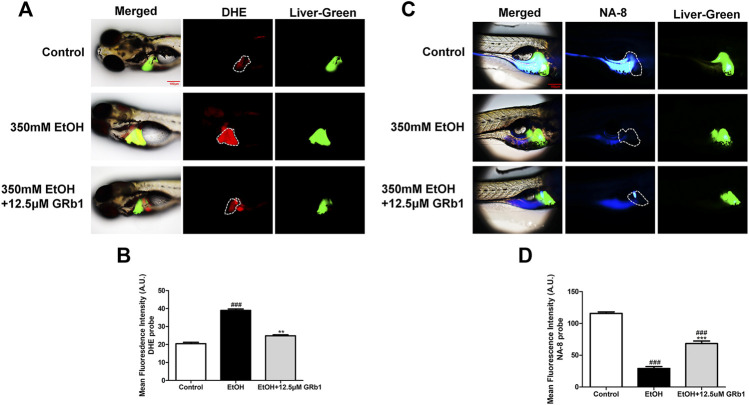
GRb1 protects zebrafish larvae against oxidative stress induced by alcohol exposure. (A) Fluorescence micrographs of DHE. Figures are magnified as 100ⅹ. (B) ROS quantification according to the mean intensity of red fluorescence using ImageJ software (n = 6–8 per group). (C) Fluorescence micrographs of NA-8. Figures are magnified as 100ⅹ. (D) GSH quantification according to the mean intensity of blue fluorescence using ImageJ software (n = 6–8 per group). Data are presented as the mean ± SEM. p < 0.05 (#), p < 0.01 (##), and p < 0.001 (###) compared the control group; p < 0.05 (*), p < 0.01 (**), and p < 0.001 (***) compared with the 350 mM EtOH group.

Acknowledgments
This image is the copyrighted work of the attributed author or publisher, and ZFIN has permission only to display this image to its users. Additional permissions should be obtained from the applicable author or publisher of the image. Full text @ Front Pharmacol