
|
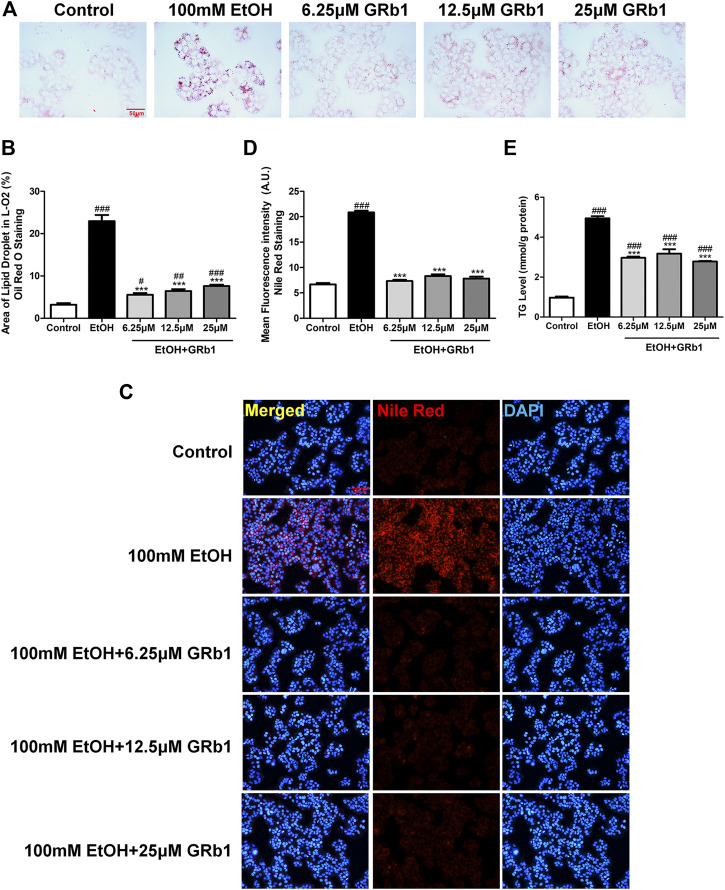
FIGURE 4 GRb1 reduces lipid accumulation stimulated by alcohol in L-O2 cells. (A) Oil Red O staining of L-O2 cells. Figures are magnified as 400ⅹ. (B) Quantitative analysis of the area of lipid droplets in L-O2 cells based on Oil Red O staining using ImageJ software. (C) Nile Red staining of L-O2 cells. Figures are magnified as 200ⅹ. (D) Quantitative analysis of the mean fluorescence intensity of Nile Red using ImageJ software. (E) Triglyceride levels in L-O2 cells. The data are displayed as the means ± SEM. p < 0.05 (#), p < 0.01 (##), and p < 0.001 (###) compared the control group; p < 0.05 (*), p < 0.01 (**), and p < 0.001 (***) compared with the 100 mM EtOH group.