
|
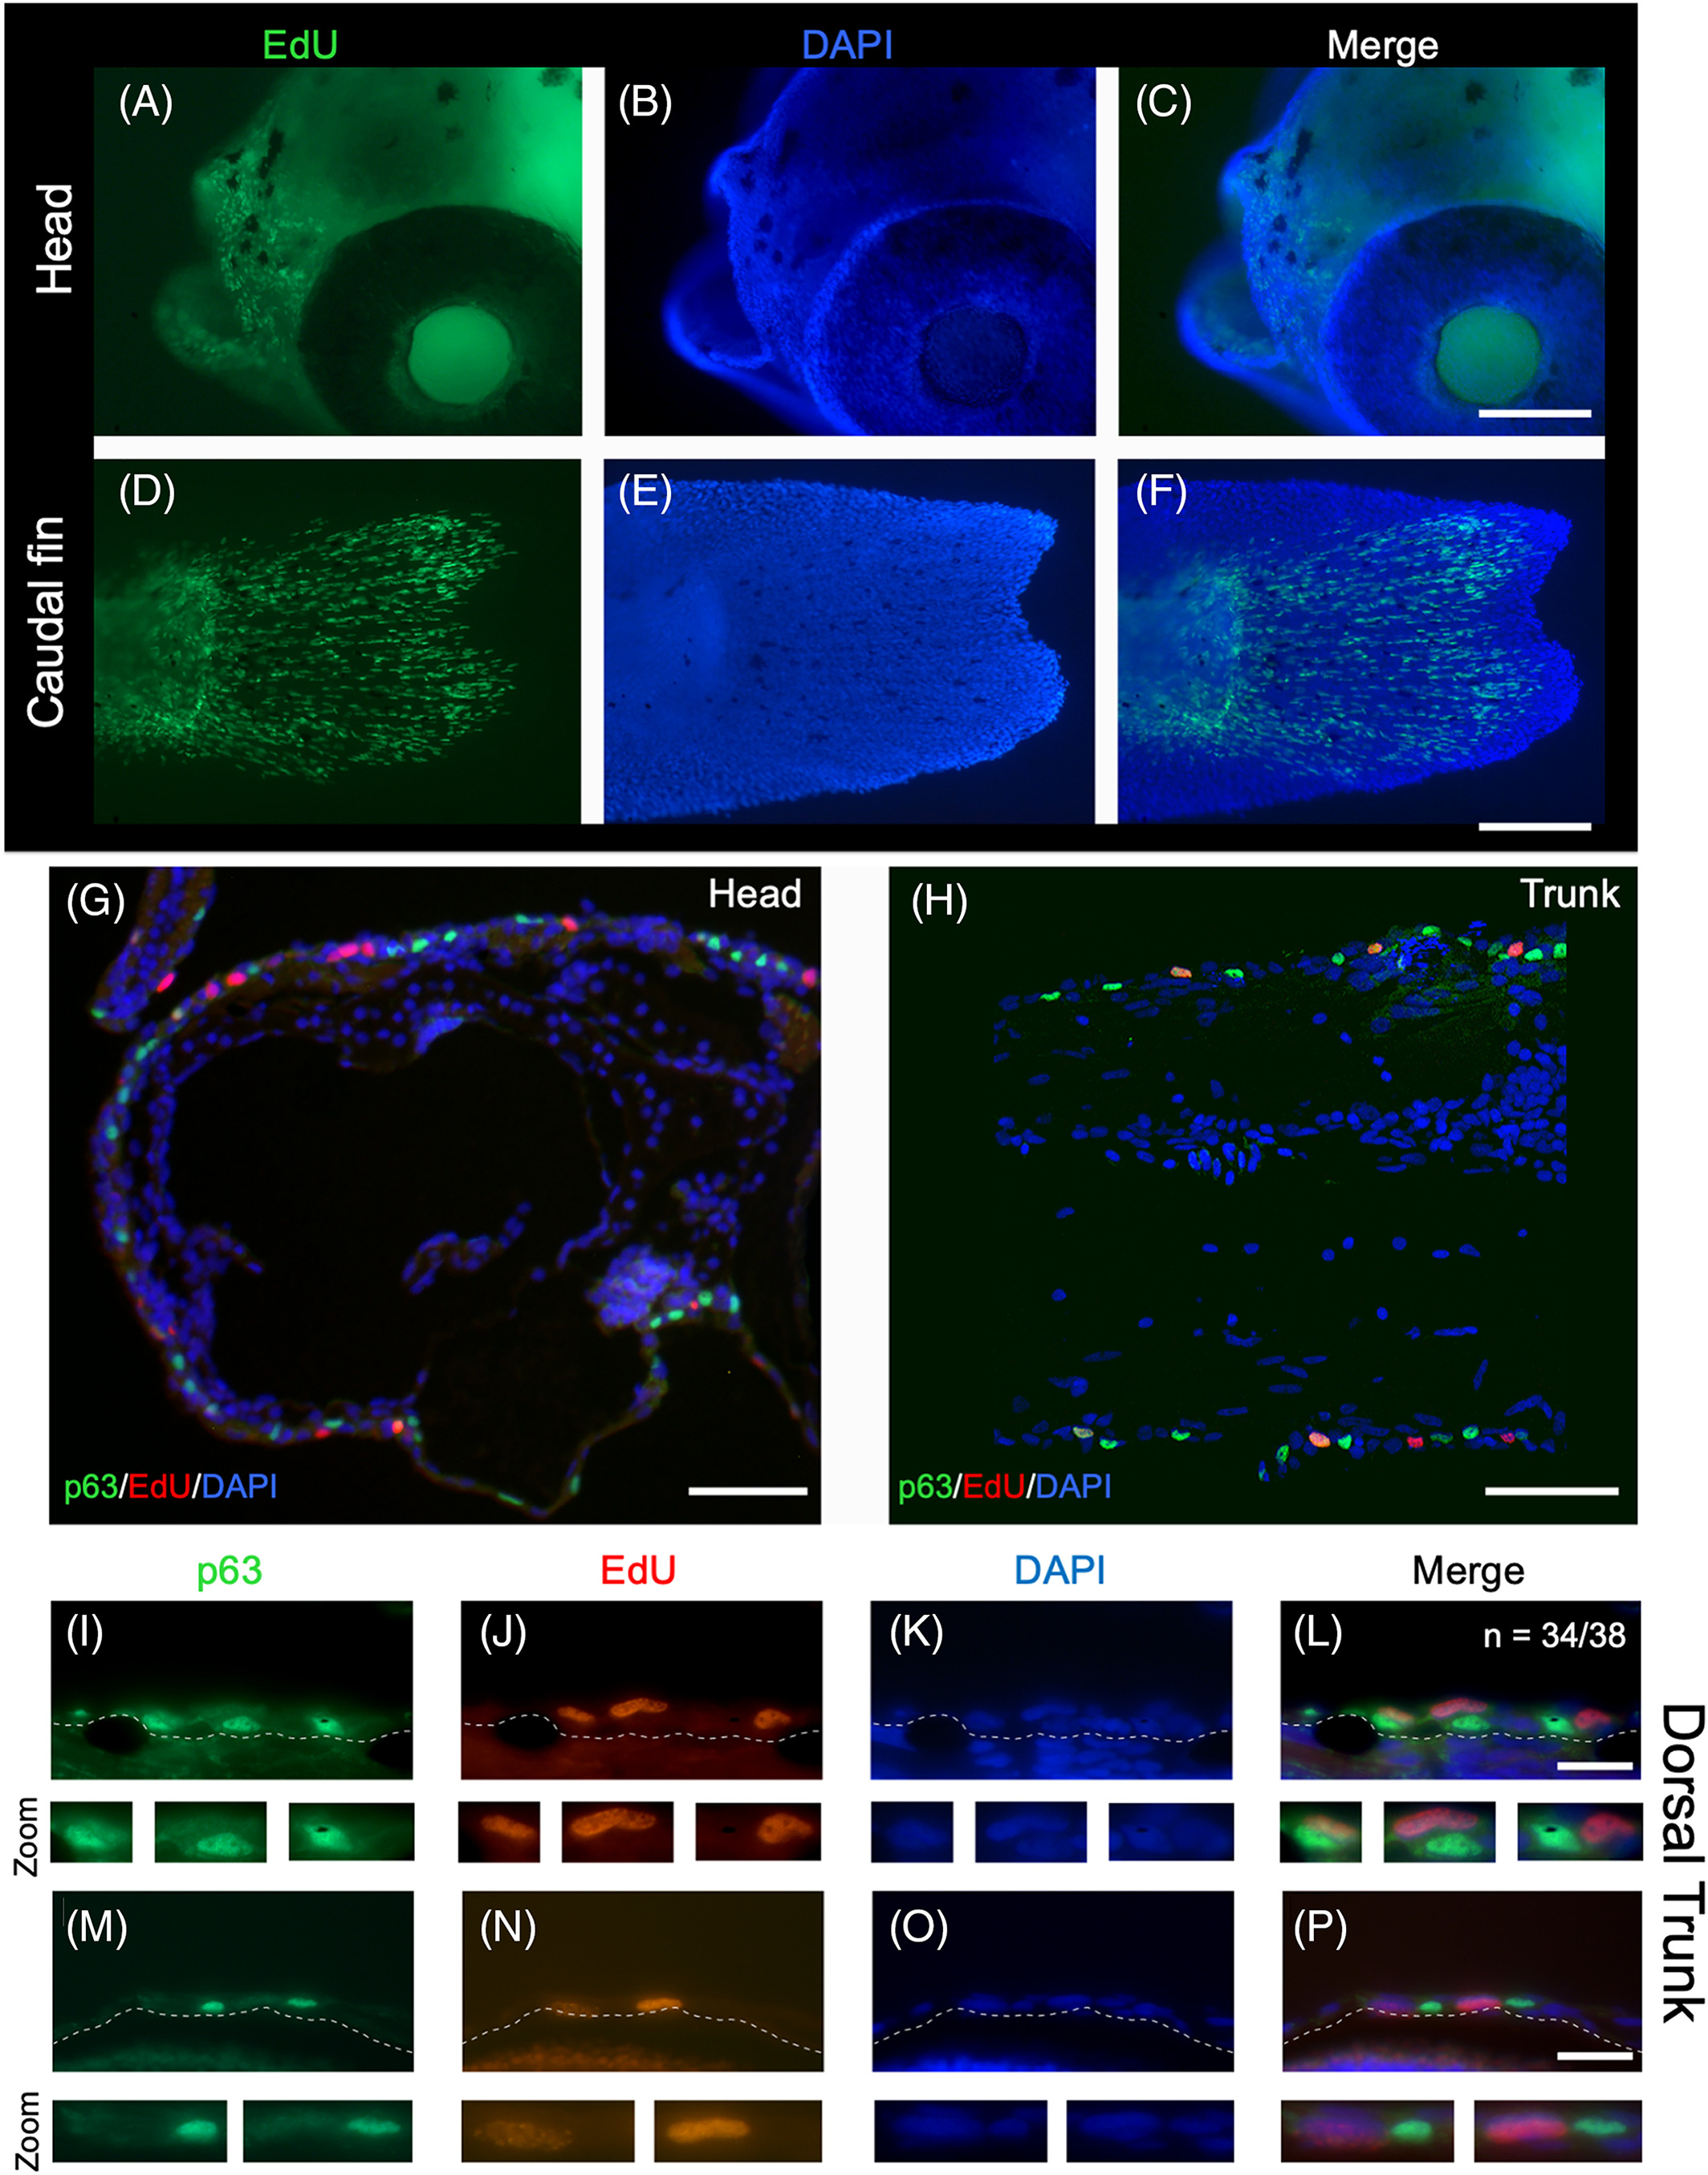
Fig. 3 High levels of epidermal cell proliferation at 5 mm SL, as detected by EdU nucleotide incorporation. A‐F, Whole‐mount EdU staining from a 6‐day postfertilization (dpf) zebrafish larvae. A‐C, EdU‐labeled cells in the head. D‐F, EdU‐labeled cells in the caudal fin. G‐H, Longitudinal histological section of a 6‐dpf larva immunostained for anti‐p63 and subjected to EdU detection and DAPI staining. I‐P, Double labeling of anti‐p63 and EdU in longitudinal sections from 5‐mm‐SL fish. Selected nuclei from the top panels are shown amplified in the bottom panels. A representation of 34 out of 38 (34/38) images showing the same expression pattern. Scale bar in A‐H is 100 μm and in I‐P is 20 μm