
Fig. 5
- ID
- ZDB-IMAGE-210316-20
- Publication
- Chambers et al., 2020 - Kctd15 regulates nephron segment development by repressing Tfap2a activity
- All Figures
- Figures for Chambers et al., 2020
|
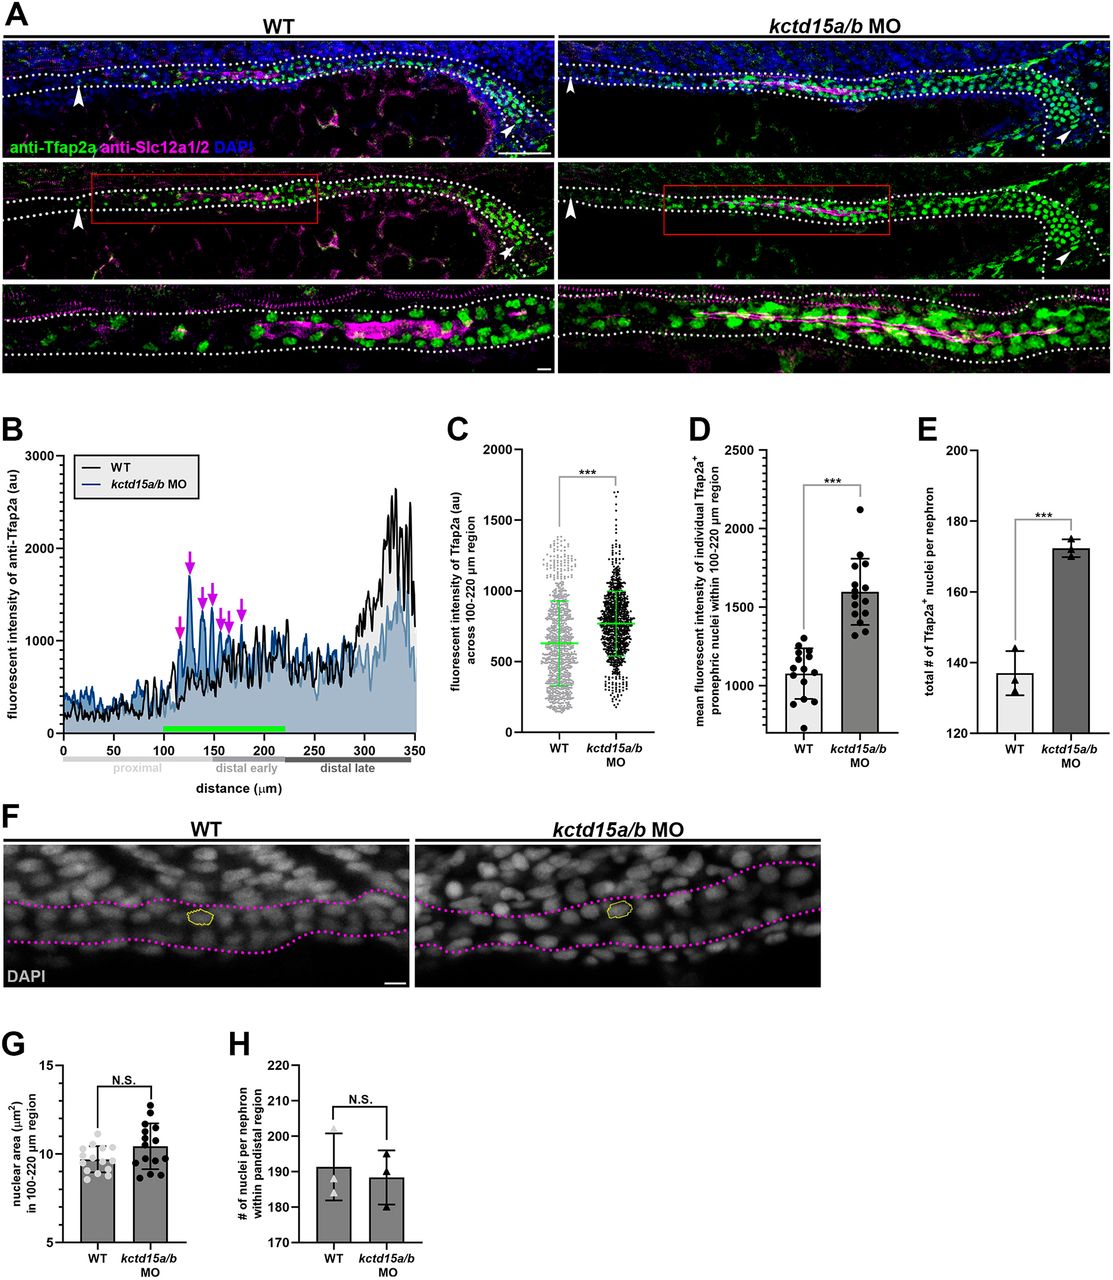
Fig. 5 kctd15a/b knockdown expands Tfap2a protein expression in the pronephros. (A) Whole-mount immunofluorescence of Tfap2a and Slc12a1/2 in wild type and kctd15a/b MO. Scale bars: 35 μm (top); 5 μm (bottom). White arrowheads indicate the limits of the pronephric Tfap2a expression domain. Red rectangle highlights the region shown at higher magnification below. Dotted lines outline the pronephric tubule. (B) Fluorescent intensity plot of Tfap2a featuring one representative wild-type (grayscale) and kctd15a/b MO (blue) sample. Purple arrows label differential Tfap2a signal peaks. Green bar spans the region of differential expression corresponding to DE locale (100-220 μm). (C) Scatterplot of Tfap2a fluorescent intensities (au) across the 100-220 μm region in three individual wild-type and MO samples. (D) Fluorescent intensity quantification Tfap2a signal within individual nuclei corresponding to the DE locale. Five individual nuclei were measured per sample. (E) Graph depicting the number of Tfap2a+ nuclei per nephron. (F) DAPI stain in the DE region of wild type and kctd15a/b MO. Magenta dots outline the pronephric tubule and yellow outlines a single nuclei. (G) Analysis of nuclear size. (H) Quantification of total number of nuclei per nephron within pandistal region. n≥3 embryos quantified for each control and experimental group. ***P<0.001; N.S., not significant. Data are mean±s.d. Fluorescent intensities and cell counts were analyzed using unpaired t-tests.