
Image
|
Figure Caption
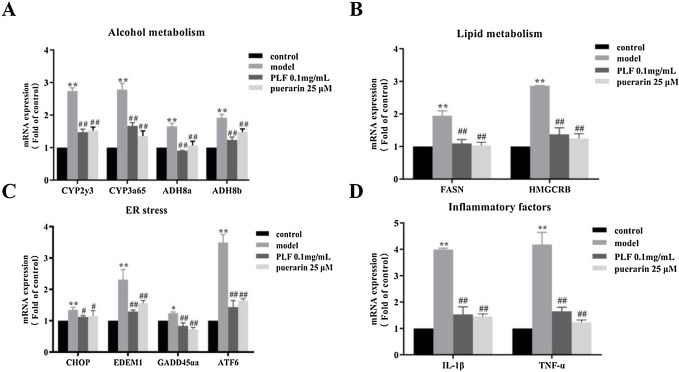
Fig. 7 Fig. 7. mRNA expression profiles in PLF and puerarin groups after induction by alcohol of zebrafish larvae and molecular mechanisms. (A) mRNA expression of alcohol metabolism-related genes. (B) mRNA expression of lipid metabolism-related genes. (C) mRNA expression of endoplasmic reticulum stress-related genes. (D) mRNA expression of inflammatory factor-related genes. n = 25/group. **P < 0.005 in comparison with the control group. ##P < 0.005, #P < 0.05 in comparison with the 2 % EtOH group.
Acknowledgments
This image is the copyrighted work of the attributed author or publisher, and
ZFIN has permission only to display this image to its users.
Additional permissions should be obtained from the applicable author or publisher of the image.
Full text @ Biomed. Pharmacother.