
Image
|
Figure Caption
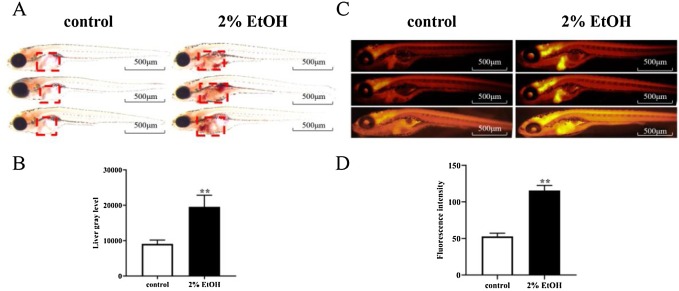
Fig. 3 Fig. 3. Staining of controls and models of alcoholic fatty liver disease. (A) Oil red O staining was used to detect hepatic steatosis in response to alcoholic injury in larvae. (B) Quantitative analysis of results of Oil red O staining (ImageJ software, n = 20/group). (C) Nile red staining. (D) Quantitative analysis of results of Nile red staining (n = 20/group). The bars indicate the mean ± SD deviation. **P < 0.005 in comparison with the control group. A value of P < 0.05 was considered statistically significant.
Acknowledgments
This image is the copyrighted work of the attributed author or publisher, and
ZFIN has permission only to display this image to its users.
Additional permissions should be obtained from the applicable author or publisher of the image.
Full text @ Biomed. Pharmacother.