
|
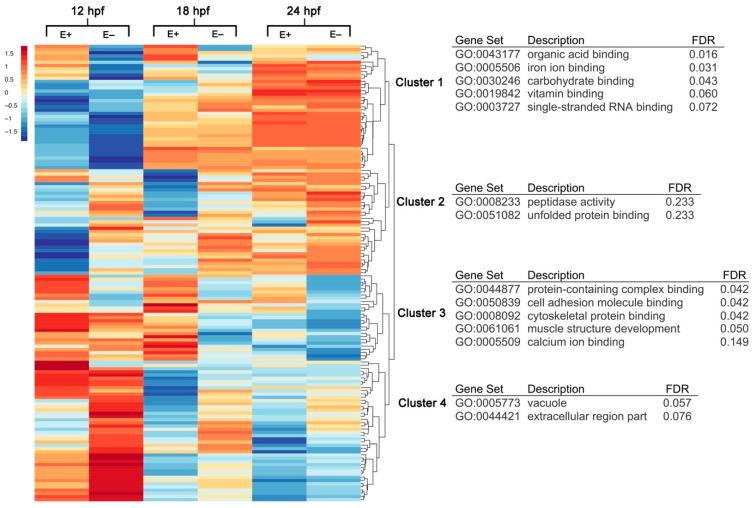
Figure 1 Hierarchical clustering and gene annotation of differentially expressed genes in E– and E+ embryos at 12, 18 and 24 hpf. Heatmap of all differentially expressed (DE) genes (n = 286, FDR < 0.1) clustered with z-score averages according to VitE status, age and gene with red color indicating greater expression relative to all-condition average and blue color indicating lower expression relative to all-condition average amongst all expression values (rows correspond to genes, columns correspond to conditions). Clusters within heatmap annotated by Gene Ontology (GO) terms organized by Benjamini–Hochberg False Discovery Rate (FDR).