
|
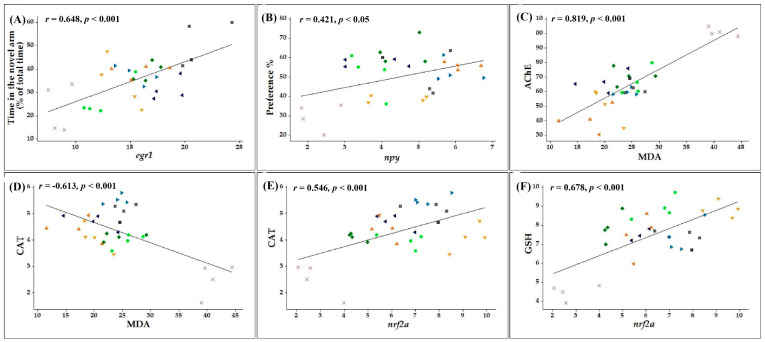
Figure 8 Pearson’s correlation coefficient between behavioral or biochemical parameters and malondialdehyde (MDA) or markers of gene expression (n = 10 animals per group): (A) Time in the novel arm (% of total time) vs. early growth response protein 1 (egr1) (r = 0.648, p < 0.001), (B) Preference % vs. neuropeptide Y (npy) (r = 0.421, p < 0.05), (C) Acetylcholine esterase (AChE) vs. malondialdehyde (MDA) (r = 0.819, p < 0.001), (D) Catalase (CAT) vs. malondialdehyde (MDA) (r = −0.613, p < 0.001), (E) Catalase (CAT) vs nuclear factor erythroid 2-related factor 2 (nrf2a) (r = 0.546, p < 0.001) and (F) The content of glutathione (GSH) vs. nuclear factor erythroid 2-related factor 2 (nrf2a) (r = 0.678, p < 0.001) in control (■), scopolamine (SCOP) (X), nicotine (NIC) 1 mg/L + scopolamine (SCOP) (▼), nicotine (NIC) 2 mg/L + scopolamine (SCOP) (▲), 6-hydroxy-L-nicotine (6HLN) 1 mg/L + scopolamine (SCOP) (●), 6-hydroxy-L-nicotine (6HLN) 2 mg/L + scopolamine (SCOP) (♦), cotinine (COT) 1 mg/L + scopolamine (SCOP) (►) and cotinine (COT) 2 mg/L + scopolamine (SCOP) (◄). Data are expressed as follows: AChE (nmol ATCh/min/mg protein), MDA (µmol/L), CAT (U/mg protein), GSH (µg GSH/µg protein), nrf2a (mRNA copy number, ×10,000) and egr1 (mRNA copy number, × 10,000).