
Figure 2
- ID
- ZDB-IMAGE-210301-16
- Publication
- Bello-Perez et al., 2021 - Modulation of the Tissue Expression Pattern of Zebrafish CRP-Like Molecules Suggests a Relevant Antiviral Role in Fish Skin
- All Figures
- Figures for Bello-Perez et al., 2021
|
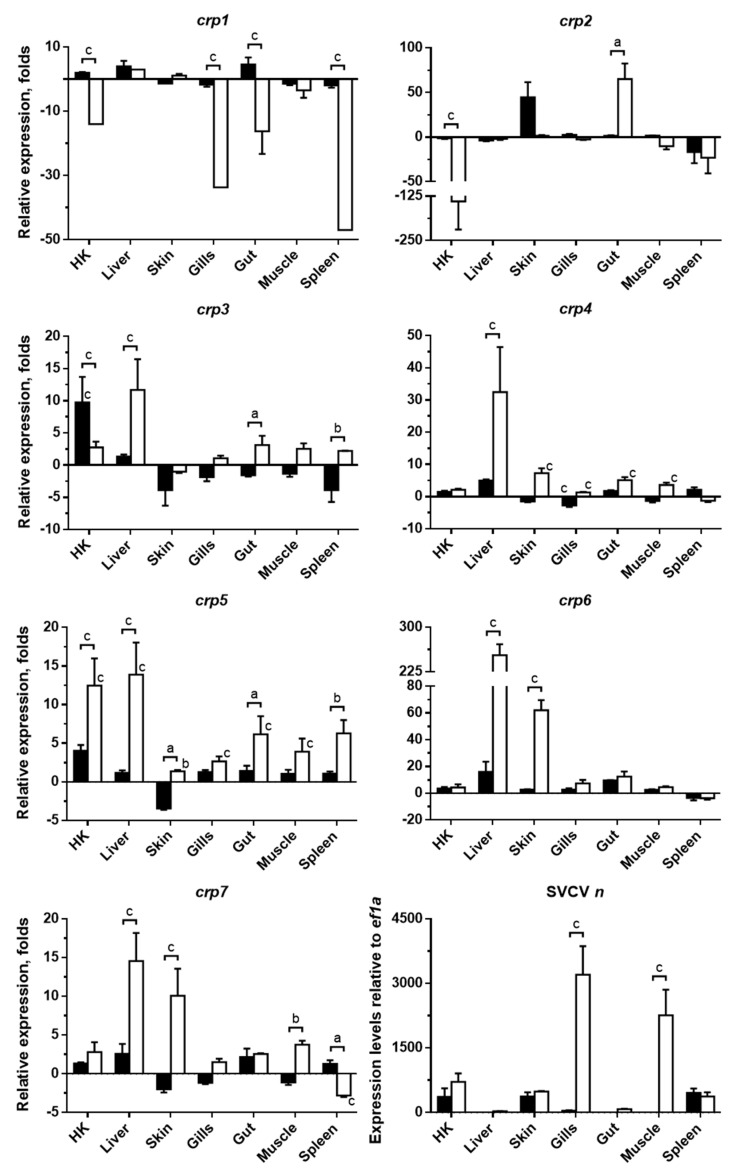
Figure 2 Expression modulation of crp1–7 in zebrafish tissues in response to spring viremia of carp virus (SVCV) infection. The transcription levels of crp1–7 and SVCV n in tissues from SVCV-infected zebrafish at 2 and 5 dpi (black and white bars, respectively) were quantified by RT-qPCR. ef1a mRNA was used as the endogenous control in all cases. crp1–7 transcription levels were also normalized to the values obtained from the corresponding samples in non-infected fish. Data are represented as the mean fold changes ± SD for crps and as the mean relative expression level ± SD for SVCV n (four different individuals in all cases). Significant differences were determined by two-way ANOVA and Sidak’s multiple comparison test. Statistical differences between the 2- and 5-dpi groups are represented by keys together with a, b, and c letters on top. Statistical differences between the 2- or 5-dpi groups and the non-infected group are represented by a, b, and c letters just on top of the corresponding bars. a, p ≤ 0.05; b, p ≤ 0.01; c, p ≤ 0.001.