
Figure 3
- ID
- ZDB-IMAGE-210301-110
- Publication
- Xu et al., 2021 - A Model Construction of Starvation Induces Hepatic Steatosis and Transcriptome Analysis in Zebrafish Larvae
- All Figures
- Figures for Xu et al., 2021
|
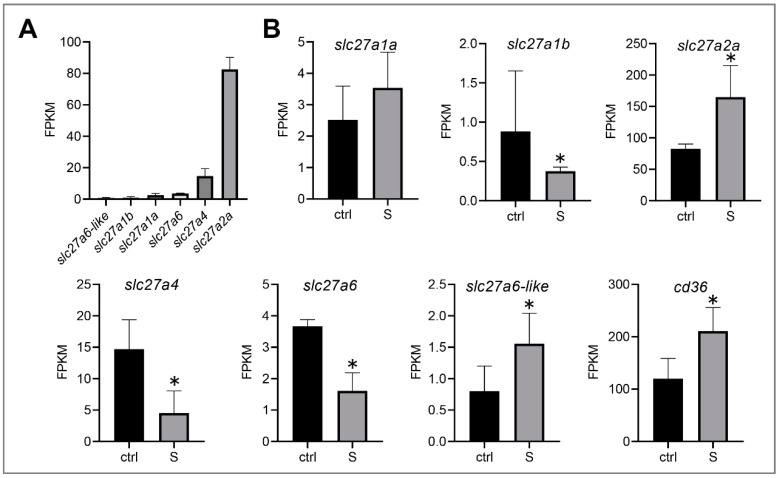
Figure 3 Effect of starvation on the gene expression involved in the transmembrane transport of fatty acids in liver tissues. (A) Gene expression of solute carrier family 27 (fatty acid transporter), including slc27a1a, slc27a1b, slc27a2a, slc27a4, slc27a6, and slc27a6-like, were extracted in the control larvae from the RNA-seq data. (B) Differential expression of fatty acid transporter and fatty acid translocase (cd36) in the control and starved larvae. The FPKM (Fragments Per Kilobases Per Millionreads) value represents the mean ± SEM of three independent RNA-seq biological replicates. * indicates significant differences (p < 0.05).