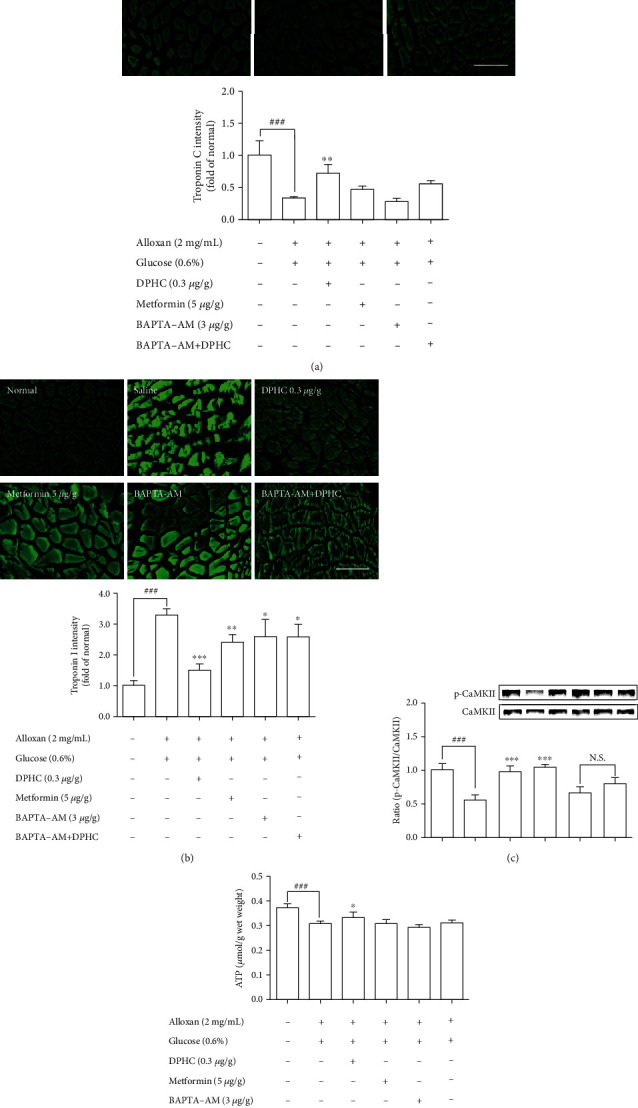
IMAGE

Figure 6

ID
ZDB-IMAGE-210227-19
Source
Figures for Yang et al., 2021
Image
Figure Caption

Figure 6

Measurement of (a) troponin C, (b) troponin I, (c) CaMKII, and (d) ATP levels in zebrafish muscle tissues. Zebrafish were injected with BAPTA-AM (3 μg/g body weight) for 1 h, after which the zebrafish were injected with DPHC (0.3 μg/g body weight) for 90 min. Experiments were performed in triplicate, and the data are expressed as mean ± SE, n = 3 per group. ,#Values having different superscript are significantly different at p < 0.05, ∗∗p < 0.01, and ∗∗∗p < 0.001 compared with the no sample-treated group; ###p < 0.001 compared with the nontreated group.

Acknowledgments
This image is the copyrighted work of the attributed author or publisher, and ZFIN has permission only to display this image to its users. Additional permissions should be obtained from the applicable author or publisher of the image. Full text @ Oxid Med Cell Longev