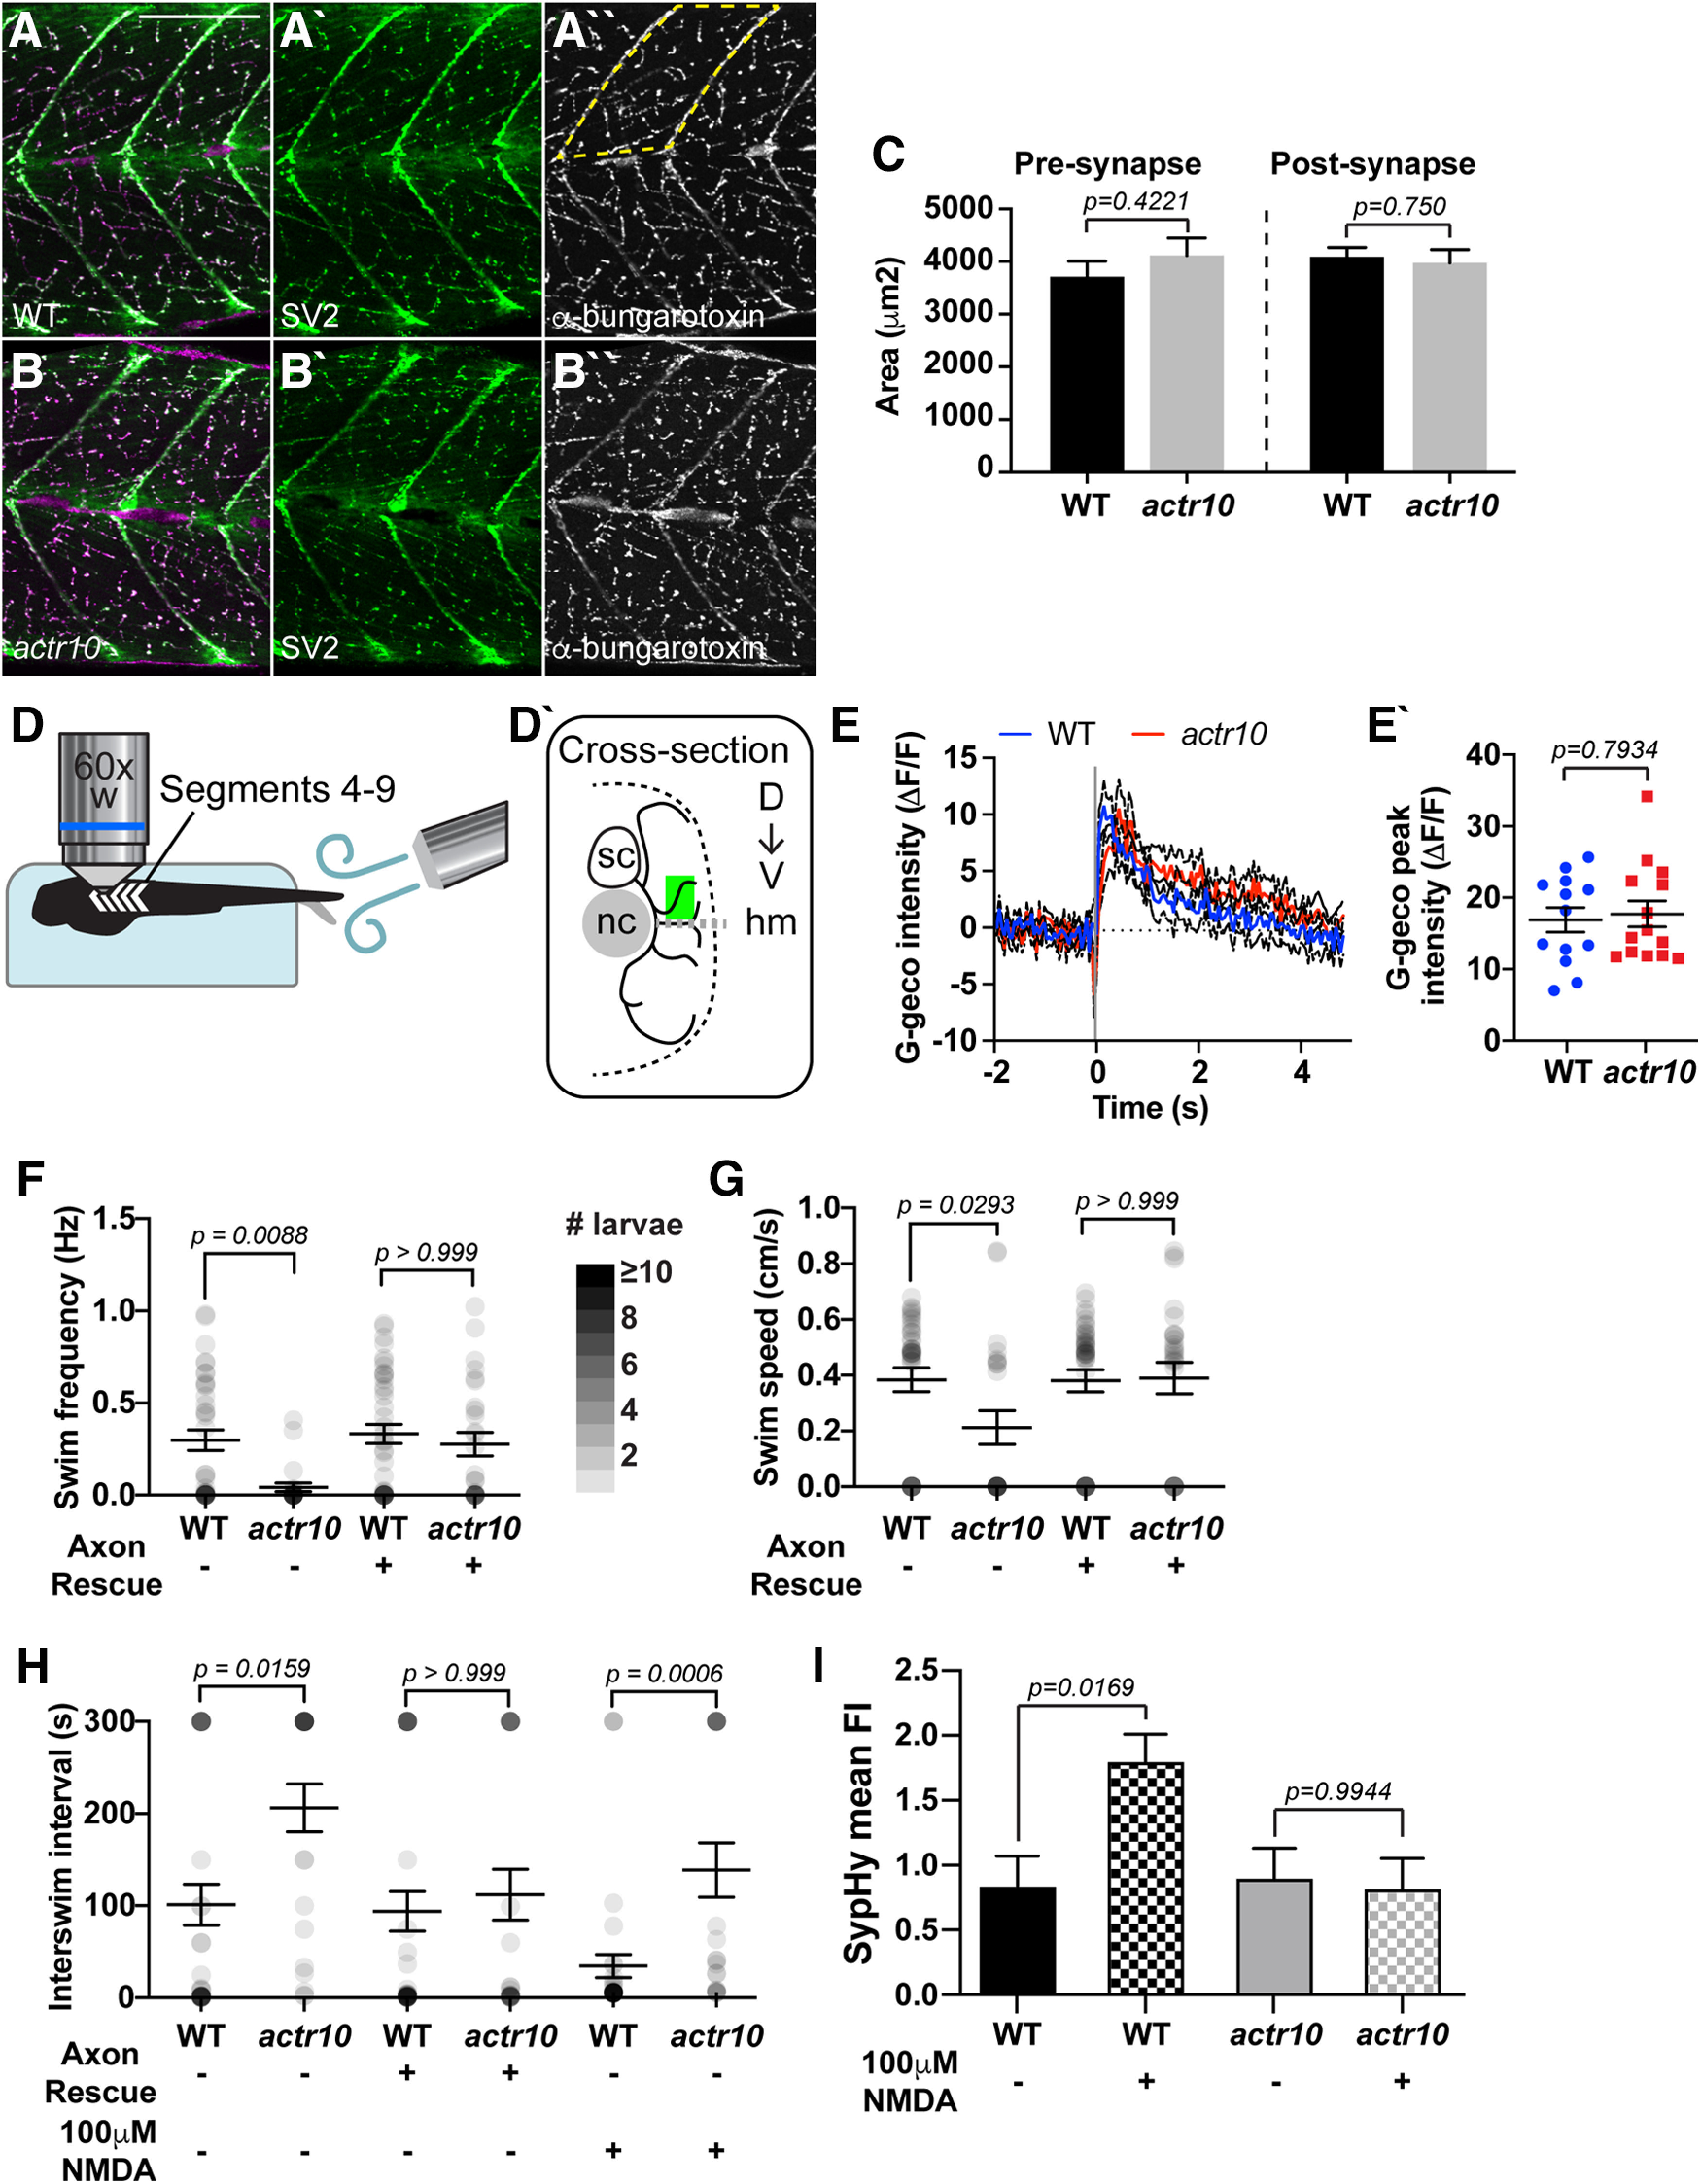
IMAGE

Figure 6.

ID
ZDB-IMAGE-210224-8
Source
Figures for Mandal et al., 2020
Image
Figure Caption

Figure 6.

Motor neuron function is decreased in actr10nl15 mutants. A, B, Antibody labeling of larval neuromuscular junctions at 4 dpf revealed no difference between WT (A) and actr10nl15 mutants (B). C, Quantification of total presynaptic and postsynaptic area in dorsal somite (area outlined by dotted line in A''). Presynapse WT: 3705 ± 390; actr10nl15: 4114 ± 302. Postsynapse WT: 4088 ± 285; actr10nl15: 3971 ± 220. D, Schematic of motor neuron axon calcium imaging. Larvae are paralyzed and immobilized in agarose with tail freed for stimulation and randomly oriented such that either left or right side of body segments 4–9 faces the objective. D', Cross-section of recording area. Motor neuron (black lines) expressing cell-fill G-Geco originate from the spinal cord (sc). Motor neuron terminals were randomly selected in a region (green rectangle) dorsal to the horizontal myoseptum (gray dotted line; hm) and lateral to the notochord (nc). E, Average temporal traces of evoked terminal G-Geco signals (ΔF/F0). Black dotted lines represent SEM. E', Scatterplot of peak terminal-Ca2+ response in WT (blue) or actr10nl15 mutants (red) show no change in response in mutants. WT: 16.9 ± 1.726; actr10nl15: 17.72 ± 1.815. F–H, Dot plots show spontaneous swim frequency, speed, and time interval between swim bouts, respectively. Dot intensity (grayscale) corresponds to number of larvae at each point with darker values indicating more larvae displayed the behavior. actr10nl15 mutants swim less frequently and are slower than WT siblings. These behavioral deficits are rescued with neuronal Actr10 expression. Frequency, WT: 0.2986 ± 0.056; actr10nl15: 0.042 ± 0.023; WT+Axon rescue: 0.333 ± 0.052; actr10nl15+Axon rescue: 0.277 ± 0.063. Speed, WT: 0.384 ± 0.043; actr10nl15: 0.212 ± 0.061; WT+Axon rescue: 0.380 ± 0.040; actr10nl15+Axon rescue: 0.390 ± 0.056. Interswim interval, WT: 101 ± 22.31; actr10nl15: 206 ± 26.05; WT+Axon rescue: 93.89 ± 21.39; actr10nl15+Axon rescue: 112 ± 27.68. H, NMDA treatment decreases interswim intervals but actr10nl15 mutants still swim less frequently than WT siblings. WT: 30.64 ± 12.68; actr10nl15: 136 ± 29.97. I, SypHy mean fluorescence (normalized to mRFP fill); 100 μm NMDA increases SypHy fluorescence in WT but not actr10nl15 mutants, indicating no increase in synaptic vesicle release. WT: 0.84 ± 0.233; WT+NMDA: 1.80 ± 0.214. actr10nl15: 0.901 ± 0.219; actr10nl15 +NMDA: 0.821 ± 0.219. Scale bars: 100 µm. All data are mean ± SEM.

Acknowledgments
This image is the copyrighted work of the attributed author or publisher, and ZFIN has permission only to display this image to its users. Additional permissions should be obtained from the applicable author or publisher of the image. Full text @ J. Neurosci.