
|
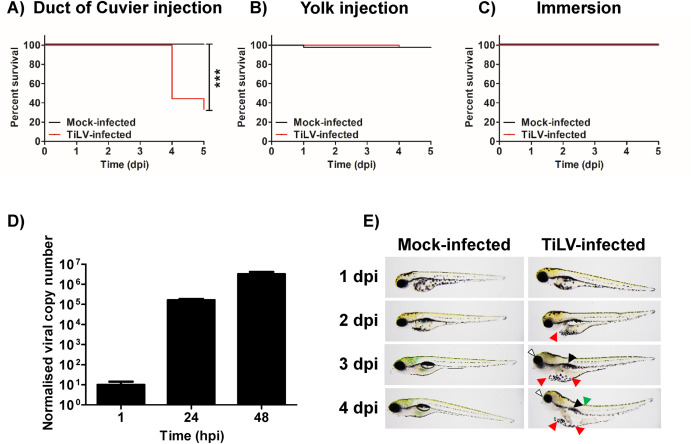
Fig. 1 Fig. 1. Zebrafish larvae are susceptible to TiLV in a systemic infection model. Survival of zebrafish larvae infected with TiLV or mock-infected (2.5 dpf) by the injection into the duct of Cuvier (A) or into the yolk (B) or infected by immersion (C). N = 20 larvae in duplicate per group per experiment. Comparisons between survival curves were made using the log-rank test. Normalized copy numbers of TiLV RNA in 5 pooled larvae of zebrafish injected with TiLV into the duct of Cuvier at 2.5 dpf (D). Data were normalized against mRNA transcript of ef1a gene of the host. Each bar represents the mean + SD of n = 4 samples. Morphology of zebrafish larvae infected with TiLV or mock-infected by the injection (2.5 dpf) into the duct of Cuvier (E). The arrows indicate morphological abnormalities in TiLV-infected larvae (white - eye abnormalities; red - yolk sac & pericardium oedema; black - swim bladder; green - spine curving). The data in Fig. 1A, B, C, D and E are representative of two independent experiments. (For interpretation of the references to colour in this figure legend, the reader is referred to the Web version of this article.)