IMAGE

Fig 5

ID
ZDB-IMAGE-210224-28
Source
Figures for Bohns et al., 2020
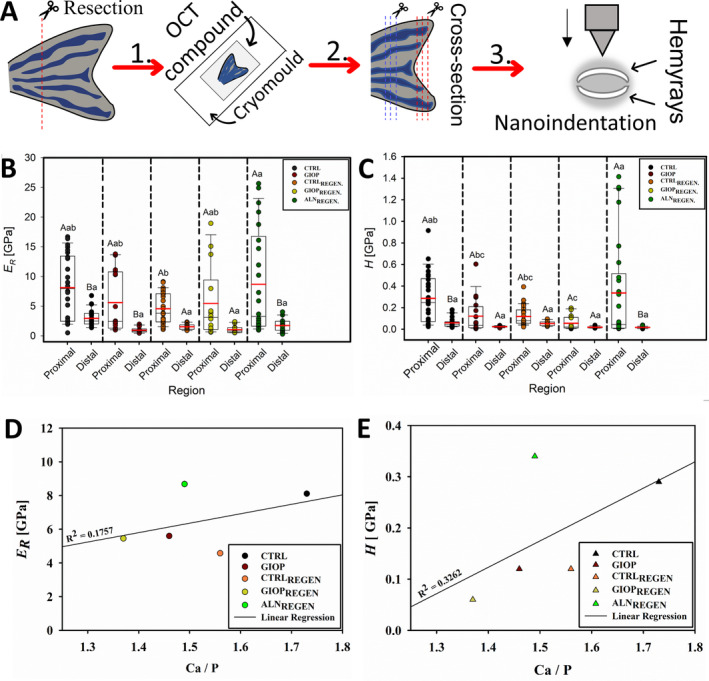
Image
Figure Caption

Fig 5

Mechanical performance of zebrafish caudal fin bony rays. (A) Procedure steps to obtain the caudal fin's slices for mechanical evaluation. Box‐plots with means (red horizontal line) and median (black horizontal line) of the Er (B) and H (C) obtained from proximal and distal parts of fins with a triboindenter. Capital letters indicate significant statistically difference between the different regions (proximal and distal) within the same treatment (p < .01). Lowercase letters indicate significant statistically difference between the same region (proximal or distal) among different treatments (p < .01). The average values of the proximal parts of both Er (D) and H (E) plotted against the Ca/P ratio. The regression lines show a weak but positive correlation between the variables.

Acknowledgments
This image is the copyrighted work of the attributed author or publisher, and ZFIN has permission only to display this image to its users. Additional permissions should be obtained from the applicable author or publisher of the image. Full text @ JBMR Plus