
Fig 1
- ID
- ZDB-IMAGE-210224-25
- Publication
- Bohns et al., 2020 - Influence of Prednisolone and Alendronate on the de novo Mineralization of Zebrafish Caudal Fin
- All Figures
- Figures for Bohns et al., 2020
|
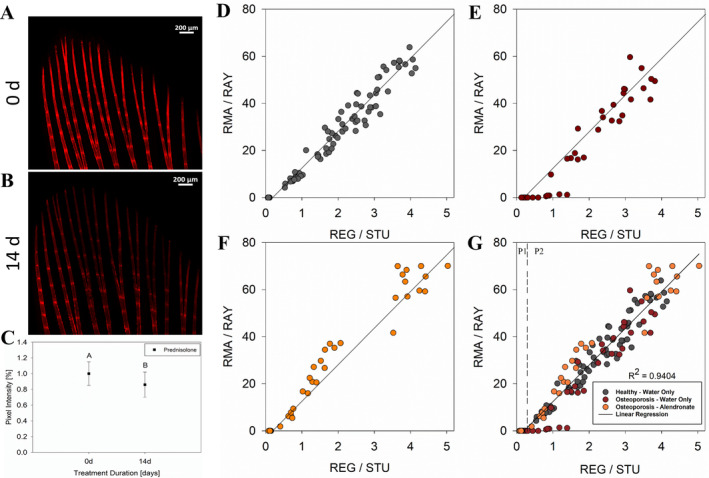
Fig 1
Glucocorticoid‐induced osteoporosis development and scatter plots showing the