
Image
|
Figure Caption
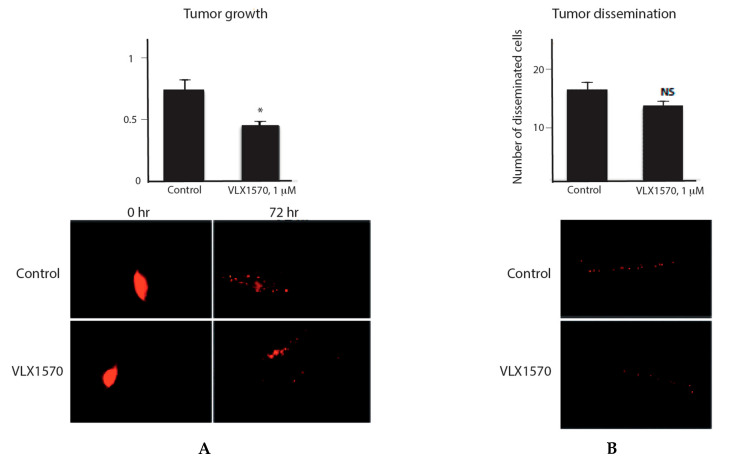
Figure 6 Antineoplastic activity in the zebrafish embryo model. (A, left) Assessment of tumor cell growth in zebrafish embryos. Embryos (n = 20) were injected with labeled ALL cells and fluorescence determined after injection (basal level) and after 72 h (average ± S.E.M.). (B, right) Assessment of tumor dissemination in zebrafish embryos. Embryos (n = 20) were injected with labeled ALL cells and labeled cells in dorsal regions were recorded after 72 h (average ± S.E.M.). Statistical significance was calculated by t-test; * p < 0.05. Scale bar 200 µm
Acknowledgments
This image is the copyrighted work of the attributed author or publisher, and
ZFIN has permission only to display this image to its users.
Additional permissions should be obtained from the applicable author or publisher of the image.
Full text @ Int. J. Mol. Sci.