
|
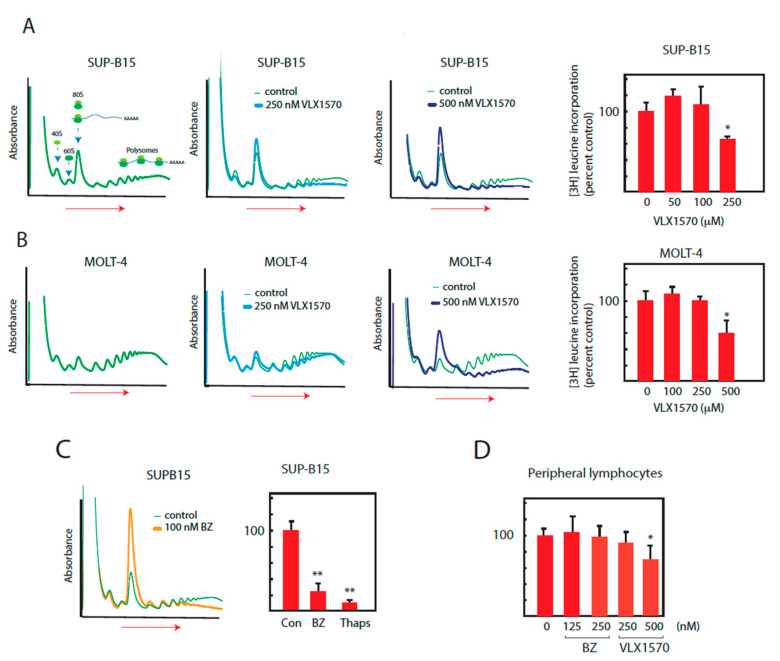
Figure 3 Suppression of translation by bortezomib and VLX1570. Cells were exposed to bortezomib or VLX1570, and ribosomes and polysomes were fractionated using sucrose gradient centrifugation. Incorporation of [3H]-leucine into acid precipitable material was measured after 6 h of drug exposure. (A,B) SUP-B15 or MOLT-4 cells were exposed to VLX1570 for 6 h and lysates were prepared in the presence of RNAase inhibitors and cycloheximide (100 μg/mL) and fractionated by sucrose gradient sedimentation (left to right). Absorbance (A280) was monitored during collection. The dose response of [3H]-leucine incorporation into acid precipitable material was determined after 6 h of drug exposure ([3H]-leucine was added during the last hour). Mean values ± S.D., * p < 0.05 Student′s t-test. (C) SUP-B15 cells were exposed to bortezomib (BZ) and lysates were fractionated by sucrose gradient sedimentation (left to right) and A280 monitored during collection. [3H]-leucine incorporation into acid precipitable material was measured after 6 h exposure to 100 nM bortezomib or 10 µM thapsigargin. Mean values + S.D., ** p < 0.01, Student′s t-test. (D) Peripheral lymphocytes were exposed to VLX1570 for 6 h and [3H]-leucine incorporation into acid precipitable material was determined. Mean values ± S.D., * p < 0.05, Student′s t-test.