
IMAGE
Figure 8—figure supplement 2—source data 1.
- ID
- ZDB-IMAGE-210220-43
- Publication
- Fontenas et al., 2021 - Spinal cord precursors utilize neural crest cell mechanisms to generate hybrid peripheral myelinating glia
- All Figures
- Figures for Fontenas et al., 2021
Image
|
Figure Caption
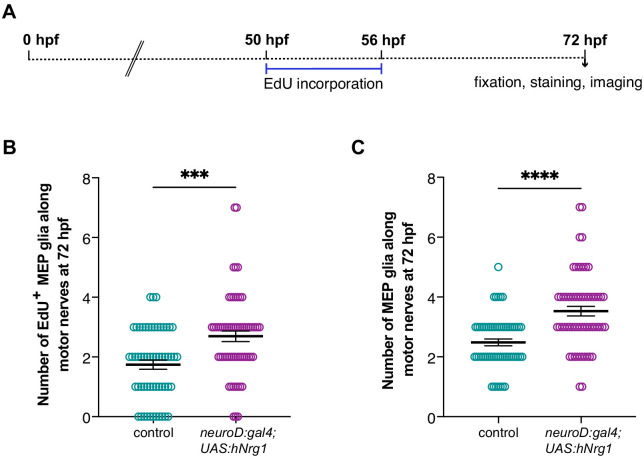
Figure 8—figure supplement 2—source data 1. (A) Experimental design for MEP glial EdU incorporation assay. (B) Mean ± SEM of number of EdU+ MEP glia per motor nerve in control (1.74 ± 0.15) and neuroD:gal4;UAS:hNrg1 (2.70 ± 0.18) larvae at 72 hpf (p=0.0002). (C) Mean ± SEM of total number of MEP glia per motor nerve in control (2.48 ± 0.12) and neuroD:gal4;UAS:hNrg1 (3.53 ± 0.16) larvae at 72 hpf (p<0.0001). (B– C) n = 58 nerves in 10 control larvae and n = 62 nerves in 12 neuroD:gal4;UAS:hNrg1 larvae.
Acknowledgments
This image is the copyrighted work of the attributed author or publisher, and
ZFIN has permission only to display this image to its users.
Additional permissions should be obtained from the applicable author or publisher of the image.
Full text @ Elife