
Figure 3—figure supplement 1.
- ID
- ZDB-IMAGE-210220-30
- Publication
- Fontenas et al., 2021 - Spinal cord precursors utilize neural crest cell mechanisms to generate hybrid peripheral myelinating glia
- All Figures
- Figures for Fontenas et al., 2021
|
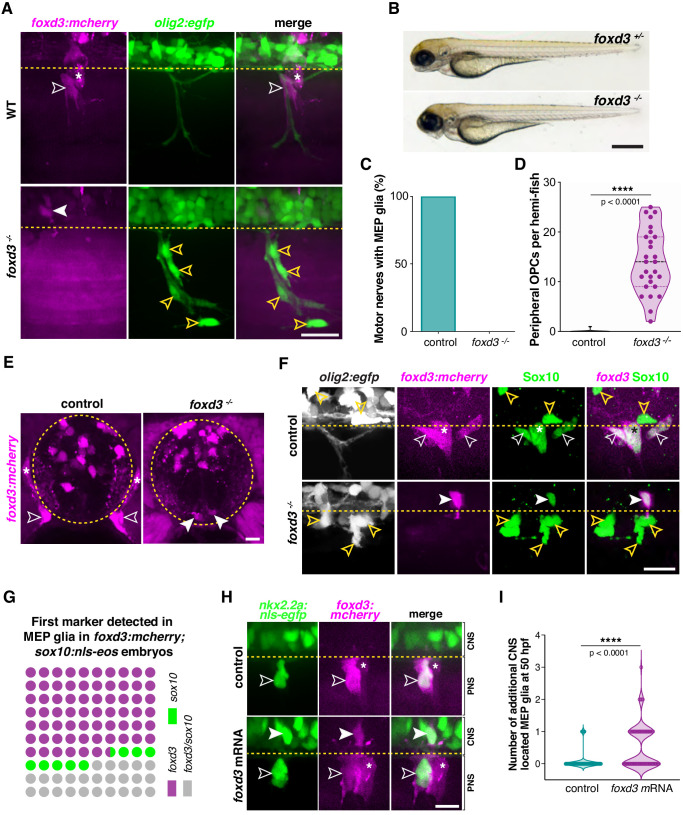
Figure 3—figure supplement 1. (A) MEP TZ in a foxd3:mcherry;olig2:egfp larvae showing foxd3+ MEP glia (white outlined arrowhead) along the motor root of a foxd3+/- control larva and stalled in the spinal cord of a foxd3-/- larva (white arrowhead) at 3 dpf. Note the presence of peripheral OPCs (yellow outlined arrowheads) along motor nerve axons in a foxd3-/- sibling lacking peripheral MEP glia. (B) Bright-field images of foxd3+/- and foxd3-/- siblings at 3 dpf reveal no developmental delay in foxd3-/- larvae. (C) Percentage of motor nerves with MEP glia in foxd3+/- (n = 150 nerves from 10 larvae) and foxd3-/- siblings (n = 270 nerves from 27 larvae) at 3 dpf. (D) Mean ± SEM of peripheral OPCs in olig2:egfp;foxd3:mcherry;foxd3+/- (0.07 ± 0.07, n = 15 larvae) and foxd3-/- (14.07 ± 1.2, n = 27 larvae) larvae at 3 dpf; p<0.0001. (E) Transverse sections of the spinal cord in foxd3:mcherry;foxd3+/- and foxd3-/- larvae showing MEP glia (outlined arrowheads) at the motor nerve root in a control sibling and MEP glia (arrowheads) in the lateral floor plate in a foxd3 mutant at 72 hpf. (F) Immunohistochemistry showing Sox10+/foxd3+ MEP glia (white outlined arrowheads) along motor nerve root axons in a foxd3+/- control embryo, and a Sox10+/foxd3+ MEP glial cell (white arrowhead) stalled in the spinal cord of a foxd3-/- larvae at 3 dpf. Yellow outlined arrowheads show OPCs in the spinal cord in a control larva and along peripheral axons in a foxd3-/- larva. Asterisks denote the DRG in control larvae. Note the absence of DRG in foxd3 mutants. (G) Dot plot of markers first detected in MEP glia, in percent. (H) Control and foxd3 mRNA-injected nkx2.2a:nls-egfp;foxd3:mcherry embryos showing a nkx2.2a+/foxd3+ MEP glia (outlined arrowhead) in the PNS in a control embryo and nkx2.2a+/foxd3+ MEP glia both in the CNS (arrowhead) and PNS (outlined arrowhead) in the injected embryo, at 50 hpf. (I), Mean ± SEM of additional CNS-located MEP glia indicates 0.08 ± 0.03 MEP glia in control embryos (n = 76 hemi-segments from 10 embryos), and 0.54 ± 0.07 MEP glia in foxd3 mRNA injected embryos (n = 78 hemi-segments from 10 embryos) at 50 hpf; p<0.0001. Asterisks denote the DRG and yellow dashed lines denote the edge of the spinal cord. Scale bar, (A, F) 25 µm, (B) 0.5 mm, (E) 10 µm, and (H) 20 µm.