IMAGE

Figure 1 - figure supplement 4

ID
ZDB-IMAGE-210220-12
Publication
Howard et al., 2021 - An atlas of neural crest lineages along the posterior developing zebrafish at single-cell resolution
All Figures
Figures for Howard et al., 2021
Image
Figure Caption

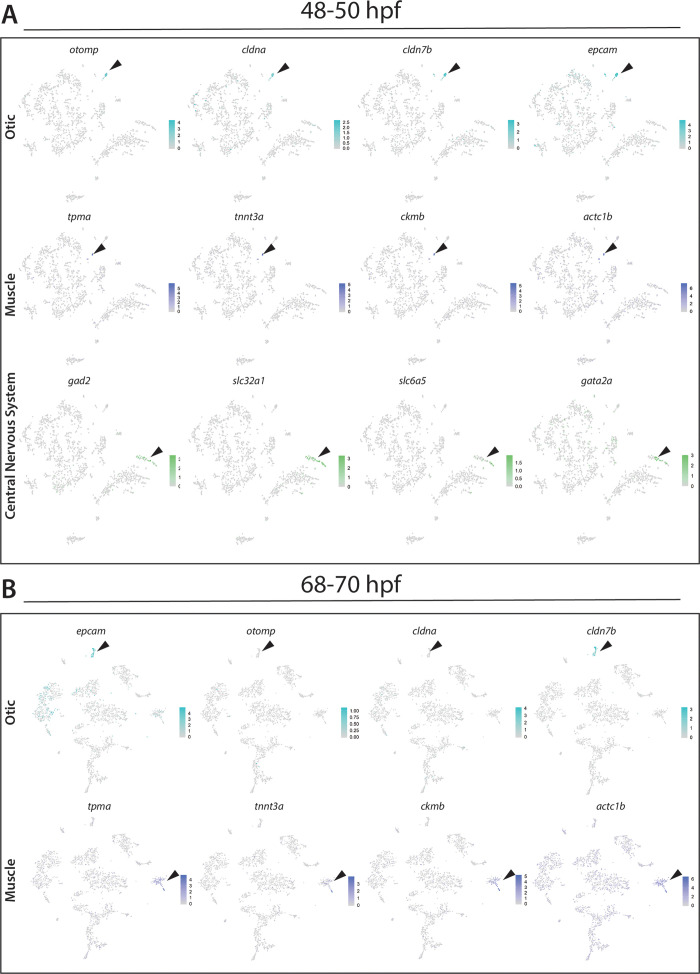
Figure 1 - figure supplement 4 Identification of otic vesicle, muscle, and central nervous system (CNS) cellular populations.

(A) Panel of tSNE feature plots at 48–50 hpf that identify combinatorial expression of otic vesicle (otomp, cldna, cldn7b and epcam), muscle (ckmb, actc1b, tnnt3a and tpma), or CNS (slc32a1, gad1b, slc6a5, gata2a) markers. Cluster of interest denoted by black arrows. (B) Panel of tSNE feature plots at 68–70 hpf that identify combinatorial expression of otic vesicle markers (otomp, cldna, cldn7b, and epcam) or muscle (ckmb, actc1b, tnnt3a, and tpma). Cluster of interest denoted by black arrows.

Acknowledgments
This image is the copyrighted work of the attributed author or publisher, and ZFIN has permission only to display this image to its users. Additional permissions should be obtained from the applicable author or publisher of the image. Full text @ Elife