
Image
|
Figure Caption
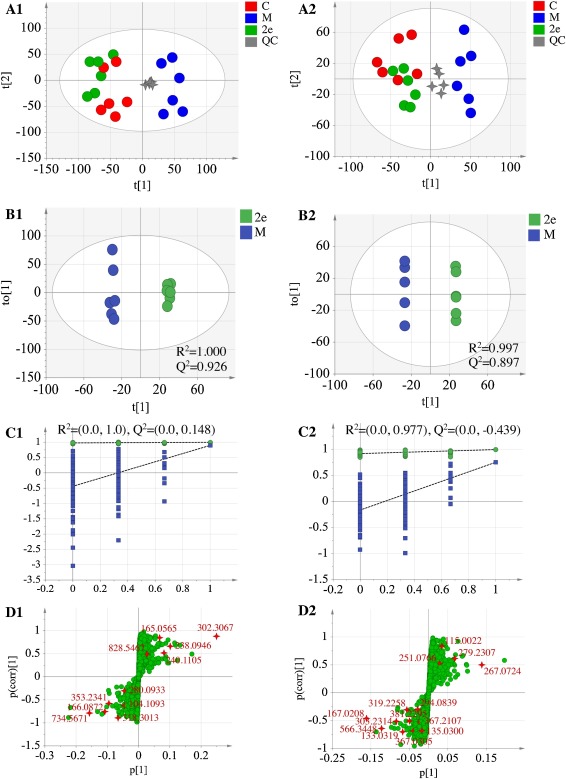
Fig. 9 Fig. 9. (A) PCA score plots of control, model and 2e groups and (B/C/D) OPLS-DA/Permutation test/S-plots of model and 2e groups in ESI + mode (A1/B1/C1/D1) and ESI- (A2/B2/C2/D2). “M” represents model group; “C” represents control group.
Acknowledgments
This image is the copyrighted work of the attributed author or publisher, and
ZFIN has permission only to display this image to its users.
Additional permissions should be obtained from the applicable author or publisher of the image.
Full text @ Biomed. Pharmacother.