
|
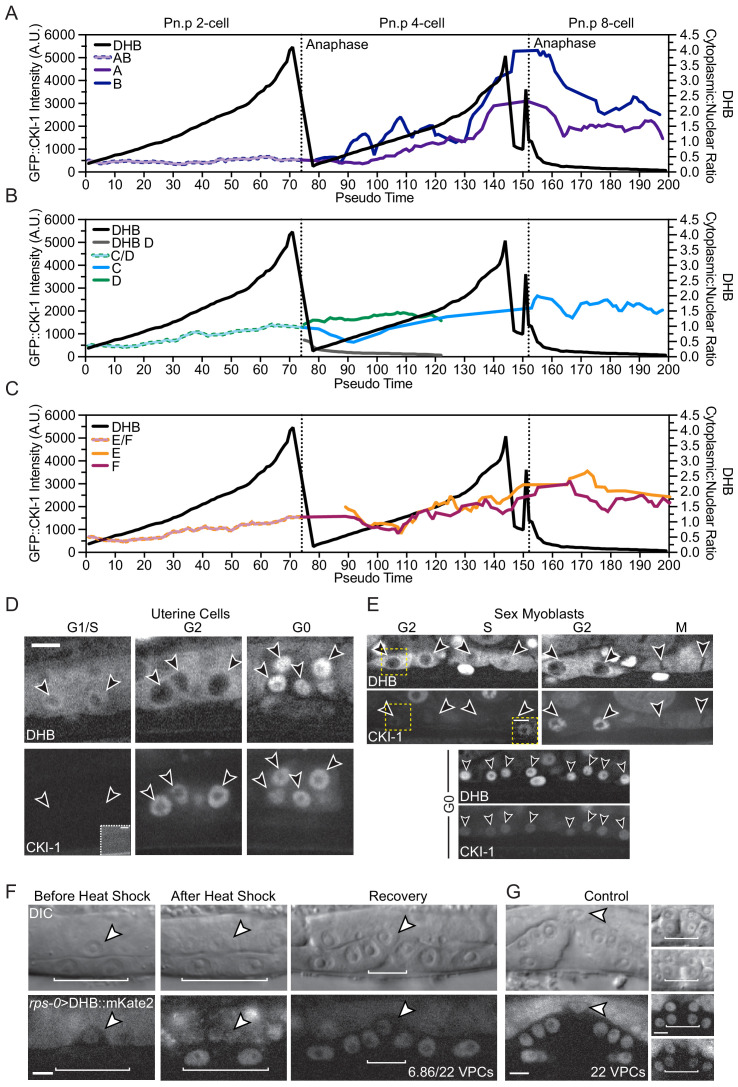
Figure 4—figure supplement 1. Related to Figure 4. (A–C) Pseudo-time plots comparing levels of GFP::CKI-1 and CDK sensor ratio in vulval AB (A), CD (B) and EF (C) lineages. (D) Representative single plane confocal micrographs show DHB (top) and GFP::CKI (bottom) localization in uterine cells in proliferative (left, middle) and quiescent cells (G0, right). (E) Representative single plane confocal micrographs show DHB (top) and GFP::CKI (bottom) localization in SM cells lineages in proliferative (top) and quiescent cells (G0, bottom). CKI-1 levels increase later in G2 (right). Inset boxes shown for CKI-1 images are contrast enhanced. (F) DIC and corresponding fluorescent images of rps-0>DHB::mKate2 expression in the AC (arrowhead) and underlying VPCs (bracket) from mid-L3 stage larvae at the Pn.p 2 cell stage (left). Larvae were heat shocked for 2 hr at 32°C (middle) and allowed to recover for 5 hr at room temperature (right). At the Pn.p 8-cell stage, determined by the extent of gonad arm extension and reflection (Sherwood et al., 2005), on average, only 6.86 of the 22 VPCs were present, which is indicative of inappropriate entry into a CDKlow G0 state. (G) Control animals at the L4 stage that were not heat shocked possessed 22 VPCs, shown as confocal merge images from the center (left), top (right, top), and bottom (right, bottom) of a single confocal z-stack. Scale bar = 5 µm.