
Fig. 2
- ID
- ZDB-IMAGE-210217-55
- Publication
- Turan et al., 2020 - The endosomal trafficking regulator LITAF controls the cardiac Nav1.5 channel via the ubiquitin ligase NEDD4-2
- All Figures
- Figures for Turan et al., 2020
|
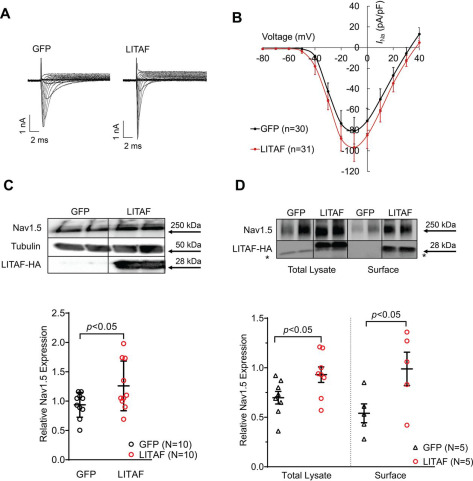
Fig. 2 Figure 2. LITAF increases INa as well as surface expression of Nav1.5 in stable HEK cells. The cells stably co-expressing Nav1.5 and GFP were co-transfected with LITAF- and DsRed-expressing plasmids or control (GFP and DsRed). A, typical Na+ traces in GFP- and LITAF-expressing HEK cells. B, current–voltage relationship for INa. INa was activated from −100 mV holding potential by depolarizing steps up to +40 mV in 10-mV increments. C, top panel, total expression of Nav1.5 and LITAF-HA. Bottom panel, respective change in Nav1.5 expression, normalized to tubulin (all values are means ± S.E.; Student's t test; n = 10). The uncropped probed membrane is shown in Fig. S1. D, total and surface protein expression of Nav1.5 and LITAF. Stable HEK cells were transfected with LITAF or GFP (control) expression plasmids. Cell-surface protein was biotinylated using sulfo-NHS-S-biotin, purified with NeutrAvidin beads from total cell lysates, subjected to SDS-PAGE, and blotted onto a polyvinylidene difluoride membrane. A representative immunoblot shows cell-surface and total lysate expression of Nav1.5, LITAF-HA, and tubulin (top panel) (the asterisk indicates an unspecific band). Respective changes in Nav1.5 expression, normalized to tubulin. All values are means ± S.E. (n = 5) (bottom).