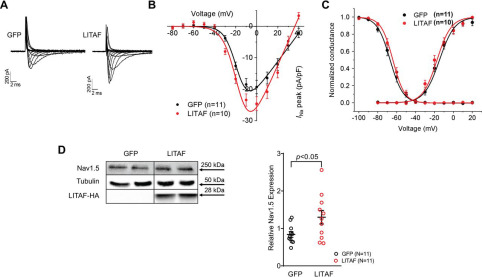
Fig. 1 Figure 1. LITAF increases INa and Nav1.5 levels in 3wRbCM. Cardiomyocytes were transduced with adenovirus encoding GFP or LITAF-HA (MOI of 10, 48 h). A, left panel, representative traces of INa in control, GFP-expressing 3wRbCM. INa was activated with depolarizing membrane potentials between −80 and +40 mV from −100 mV holding potential. Right panel, typical INa traces in GFP- and LITAF-expressing 3wRbCM. B, voltage dependence of INa current in transduced cardiomyocytes. The currents were normalized to cell capacitance (means ± S.E.; p < 0.01, 3wRbCM from three rabbits were used for both LITAF and GFP experiments). C, activation curves of INa were obtained from data shown in B, whereas inactivation curves were obtained as described under “Experimental procedures.” D, left panel, protein expression levels of Nav1.5, LITAF-HA, and tubulin. Right panel, respective changes of Nav1.5 protein levels normalized to tubulin. Although the theoretical molecular mass of the HA-tagged human LITAF is 20.6 kDa, our Western blotting data show a specific band at ∼28 kDa, which is likely due to post-translational modification (all values are means ± S.E., Student's t test, n = 11 each). *, p < 0.05.
Image
Figure Caption
Acknowledgments
This image is the copyrighted work of the attributed author or publisher, and
ZFIN has permission only to display this image to its users.
Additional permissions should be obtained from the applicable author or publisher of the image.
Full text @ J. Biol. Chem.

