
|
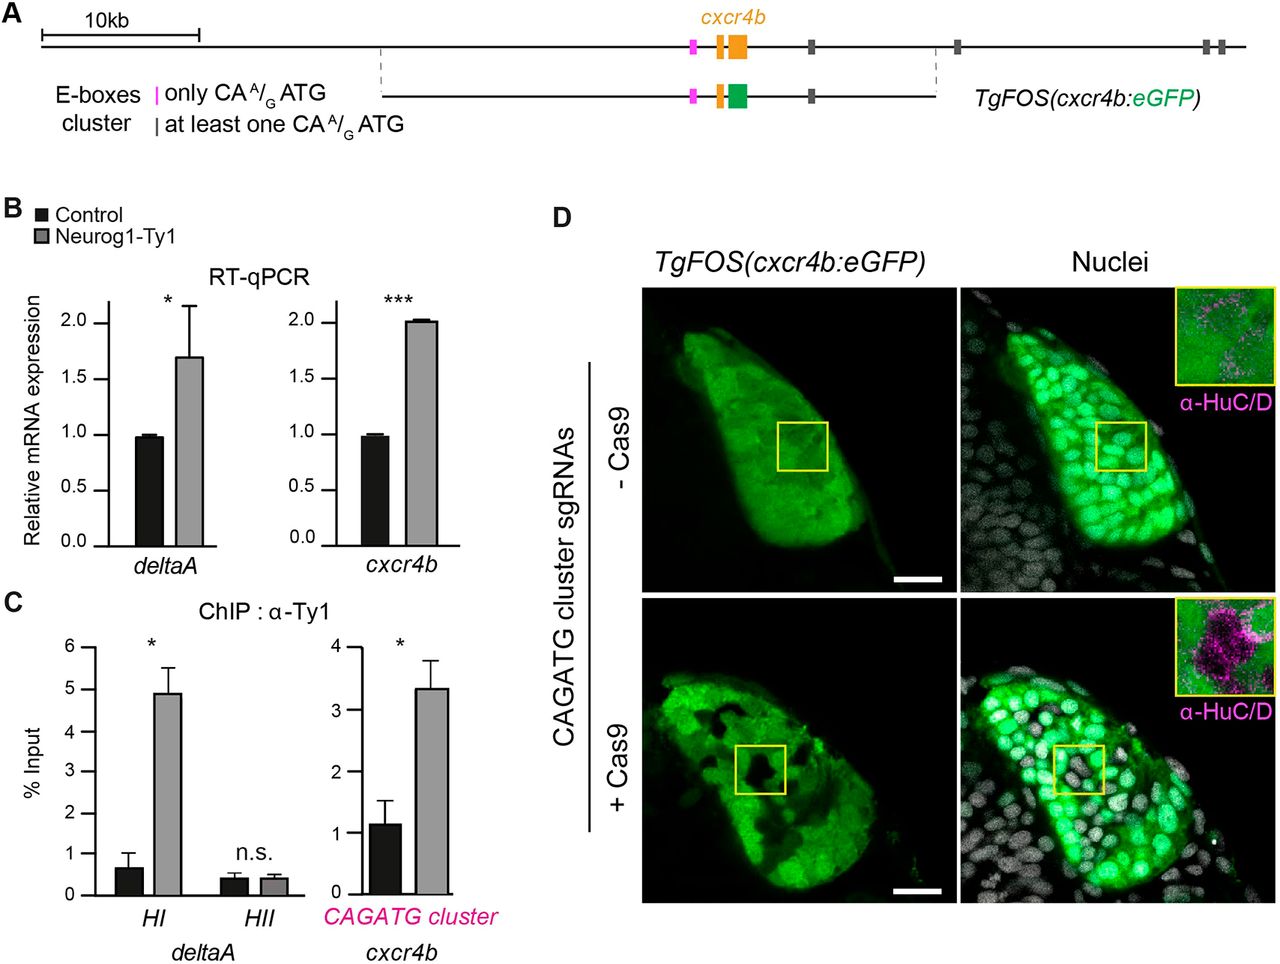
Fig. 4 Neurog1 directly controls cxcr4b expression via an upstream cis-regulatory module (CRM). (A) Schematic of the cxcr4b locus, indicating the position of exons of the cxcr4b gene (orange) and E-box clusters, which are colour-coded depending on the nature of the E-box sequences. Also presented is the position of the genomic sequences found in the TgFOS(cxcr4b:eGFP) transgene. (B) qPCR analysis of the effect of Neurog1-Ty1mRNA mis-expression on the relative mRNA levels of the known Neurog1 target gene deltaA and cxcr4b. A significant increase in expression is detected for both genes. (C) ChIP using an antibody against Ty1 and chromatin prepared from 15 hpf embryos mis-expressing Neurog1-Ty1 mRNA (grey). Control (black) represents ChIP with IgG alone. (D) Single confocal sections of TgFOS(cxcr4b:eGFP) embryos at 24 hpf, showing eGFP expression in the olfactory cups, and either HuC/D expression or nuclear labelling (TOPRO). Embryos were injected with an sgRNA pair flanking the E-box-containing CRM at the cxcr4b locus plus or minus Cas9 as a control. Insets show HuC/D expression in both conditions. Data are mean±s.e.m. *P=0.01, ***P=0.0001 (two-tailed Student's t-test). n.s., not significant. Scale bars: 20 µm.