
Image
|
Figure Caption
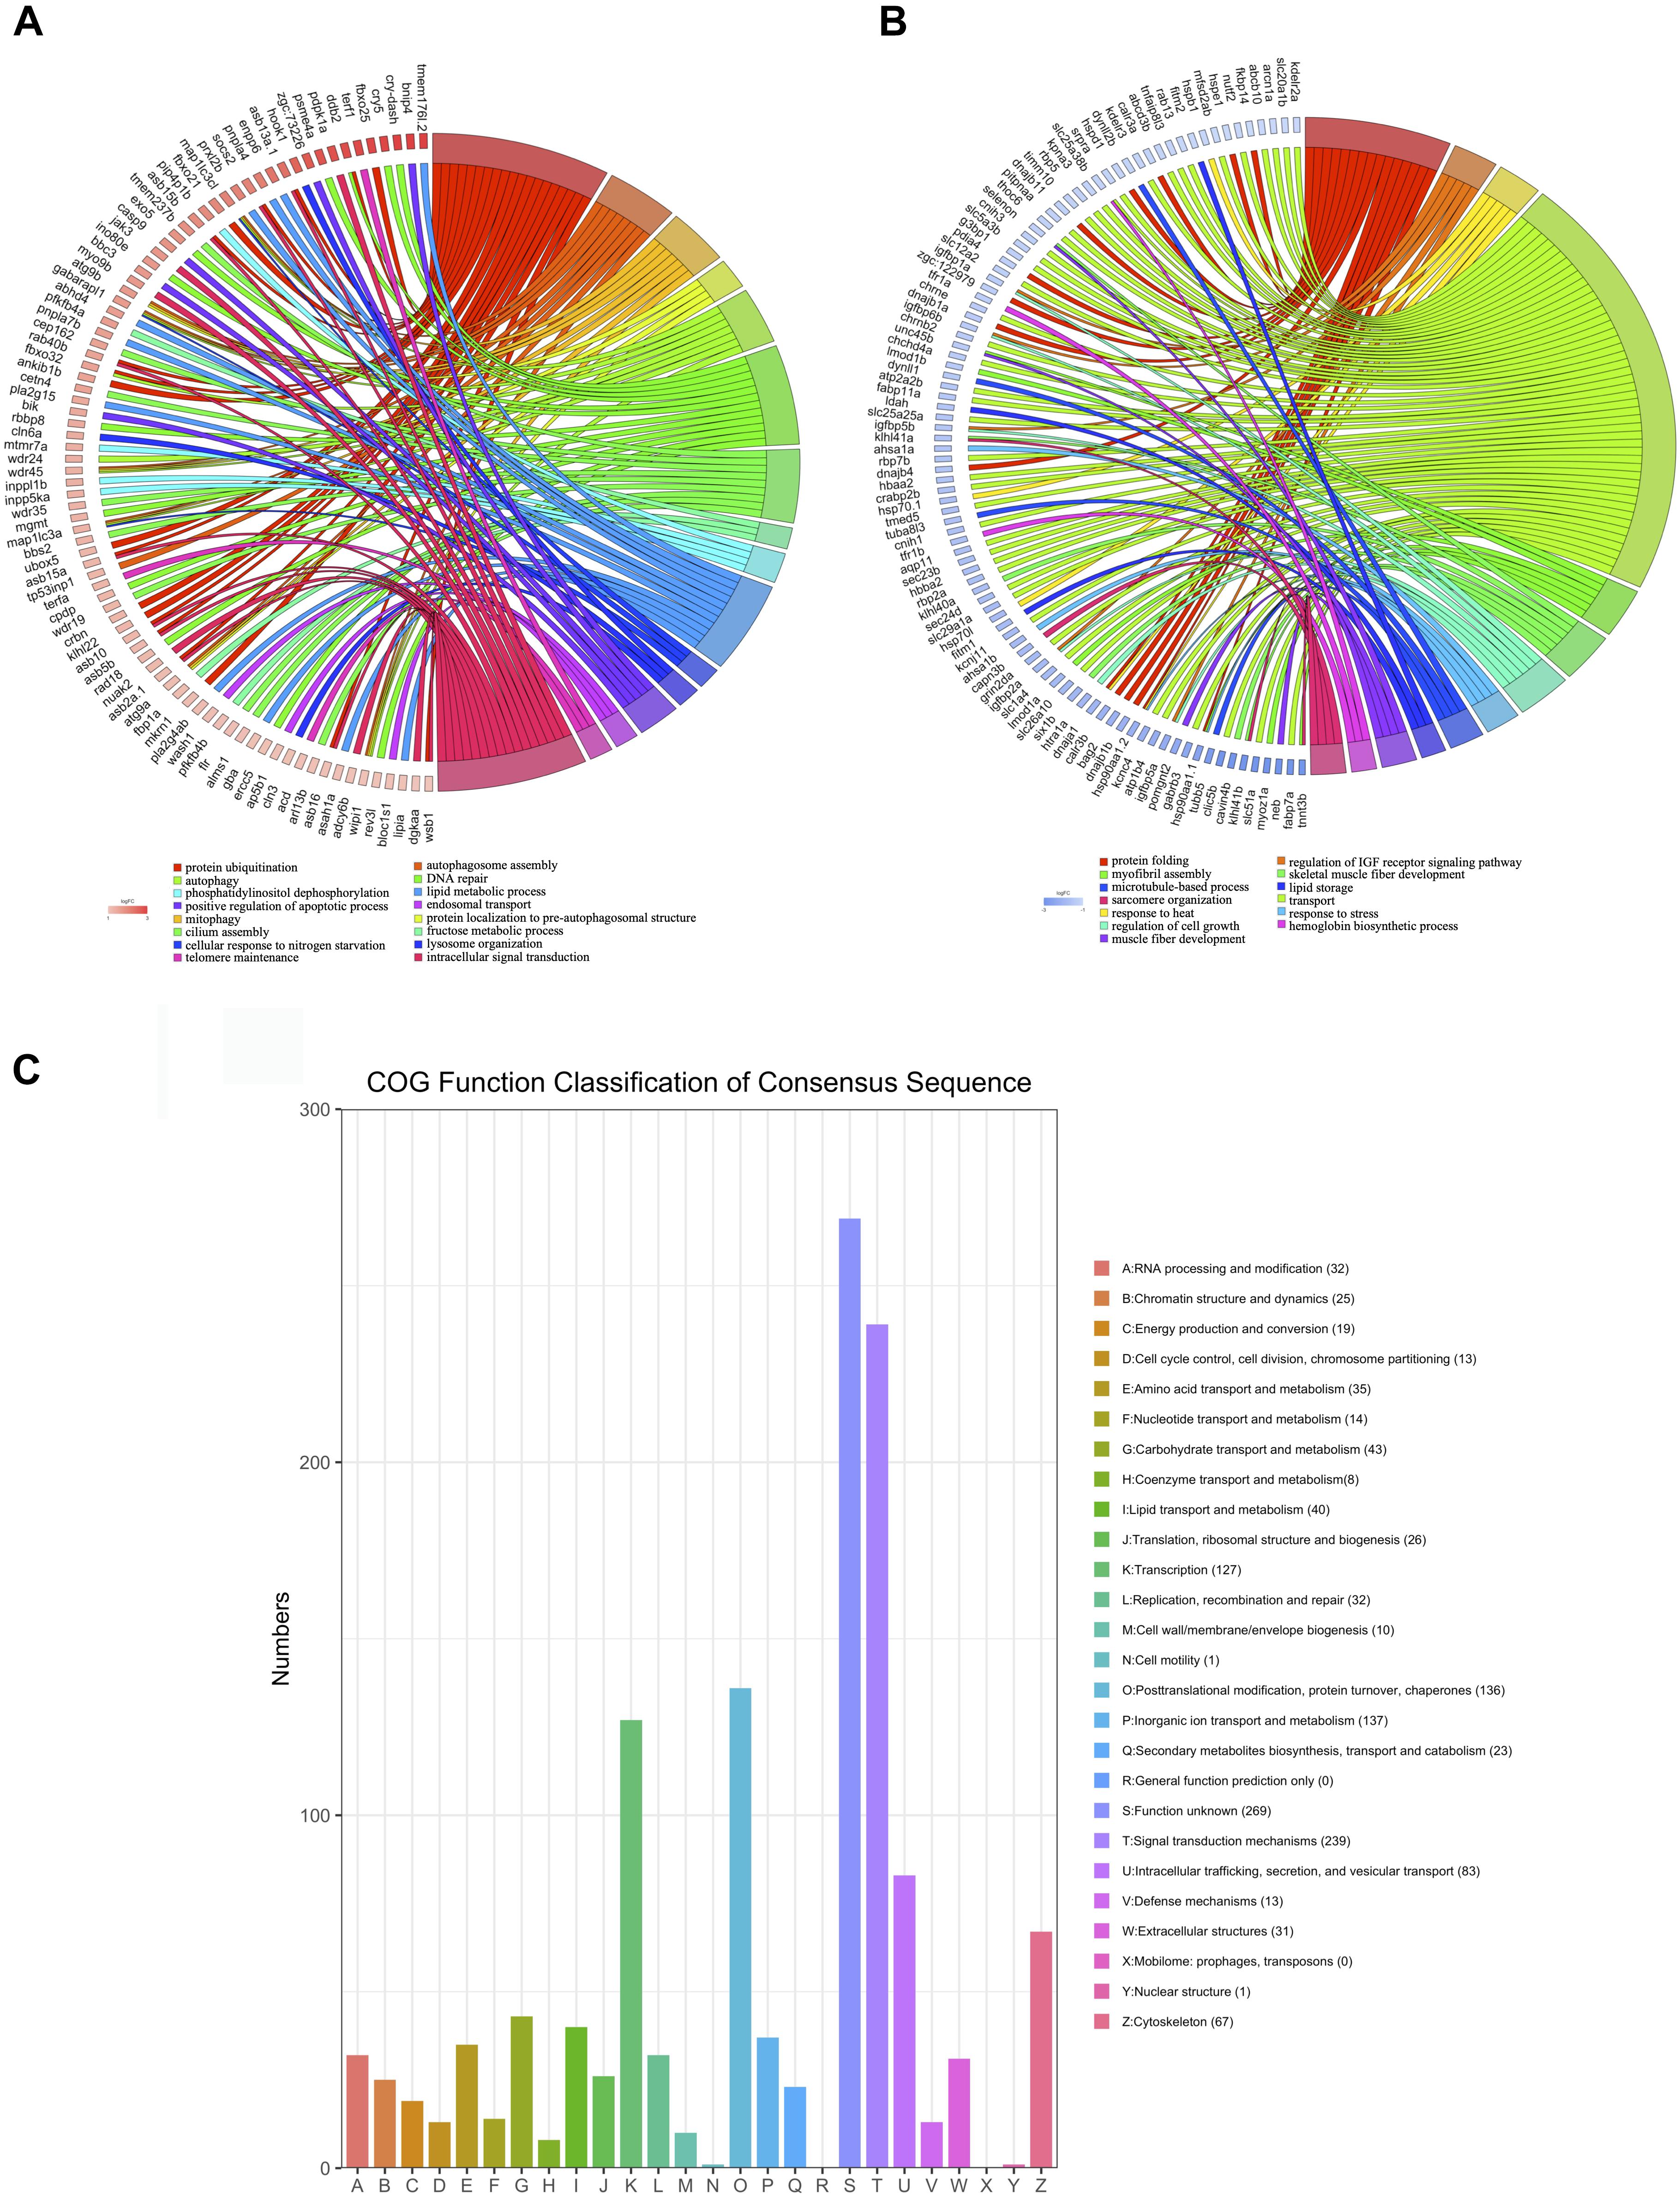
Fig. 3 Figure 3. Function analysis of DEGs (p < 0.05, fold change > 2). (A) Upregulated DEGs were assigned to representative biological processes. (B) Downregulated DEGs were assigned to representative biological processes. (C) Cluster of Orthologous Groups (COG) functional classification of the DEGs. The legend shows the name of each function and the proportion of DEGs in each functional class.
Acknowledgments
This image is the copyrighted work of the attributed author or publisher, and
ZFIN has permission only to display this image to its users.
Additional permissions should be obtained from the applicable author or publisher of the image.
Full text @ Front. Physiol.