
|
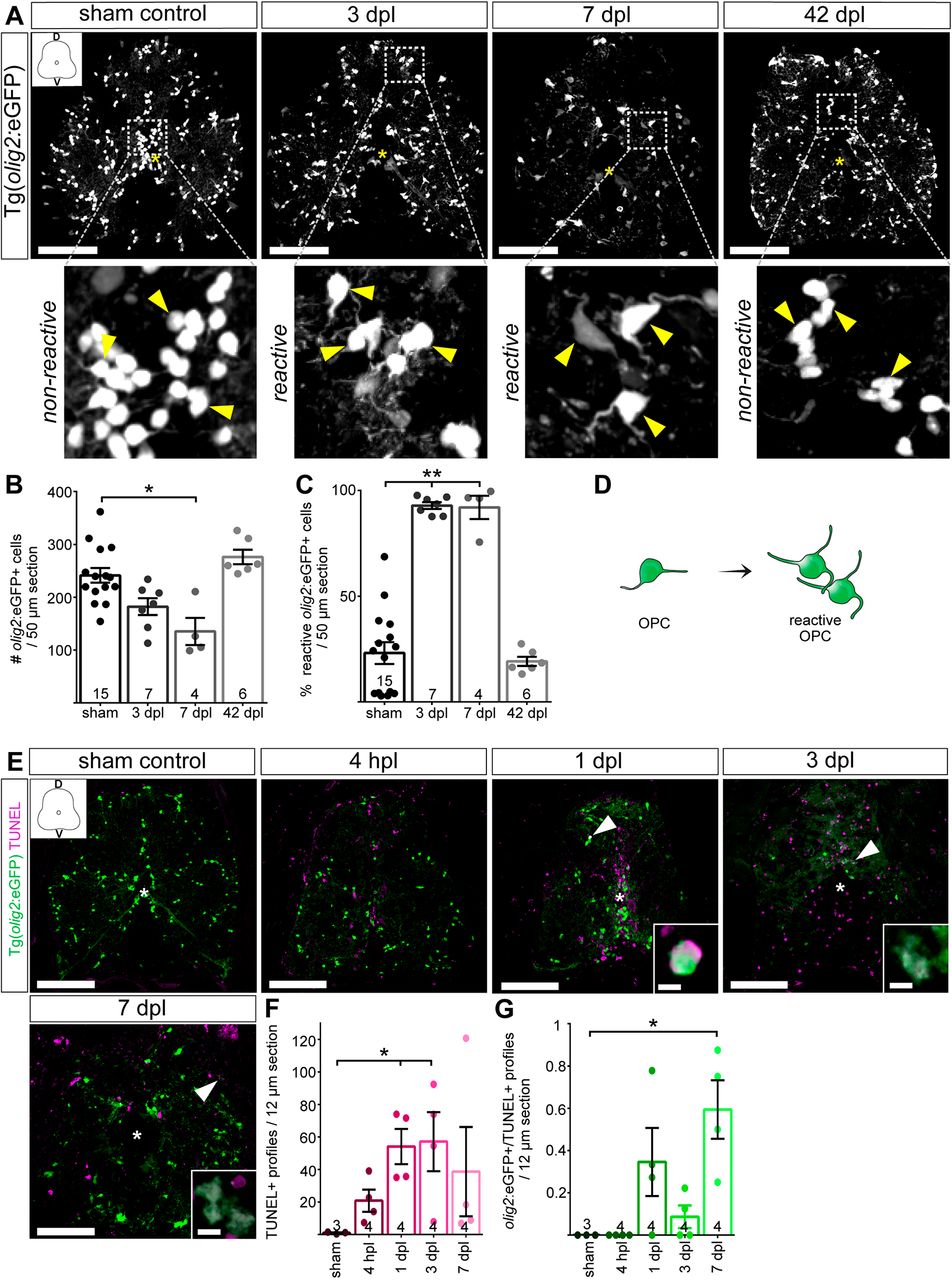
Fig. 4 OPCs undergo distinct morphological changes after spinal cord transection. (A) The morphology of parenchymal OPCs (enlargements, yellow arrowheads) changes as cells enter a ‘reactive’ state immediately after SCI. Changes are indicated by marked increase in their cell size and the extension of long multi-branched processes. Activation features persist at 7 dpl and return to control levels at 42 dpl. Images are maximum intensity projections of transverse sections. D, dorsal; V, ventral. In the overview images, a yellow asterisk indicates the central canal. Scale bars: 100 µm. (B) Stereological quantification of parenchymal olig2:eGFP+ cells 700 µm around the transection site shows a significant reduction in OPCs at 7 dpl, compared to sham controls. Data are mean±s.e.m. Numbers in the plots indicate the number of experimental animals. *P≤0.05 (Kruskal–Wallis test followed by Dunn's multiple comparisons post-hoc test). Significance is shown compared to sham control. (C) At 3 and 7 dpl, the percentage of reactive cells is significantly increased between lesioned and sham control animals. Data are mean±s.e.m. Numbers in the plots indicate the number of experimental animals. **P≤0.01 (Kruskal–Wallis test followed by Dunn's multiple comparisons post-hoc test). Significance is shown compared to sham control. (D) Schematic representation of morphological changes indicating activation features of reactive OPCs after SCI. (E) TUNEL assay to detect dying cells at 4 hpl, 1 dpl, 3 dpl and 7 dpl. Images are maximum intensity projections of transverse sections. D, dorsal; V, ventral. In the overview images, a white asterisk indicates the central canal. Scale bars: 5 µm in insets; 100 µm in overviews. (F) TUNEL+ cells were significantly increased at 1 and 3 dpl, compared to sham controls. Data are mean±s.e.m. Numbers in the plots indicate the number of experimental animals. *P≤0.05 (Kruskal–Wallis test followed by Dunn's multiple comparisons post-hoc test). Significance is shown compared to sham control. (G) A significant increase in the number of dying olig2:eGFP+/TUNEL+ cells was detected at 7 dpl. However, the number of olig2:eGFP+/TUNEL+ cells remains below 1 cell per section at all investigated time-points. Data are mean±s.e.m. Numbers in the plots indicate the number of experimental animals. *P≤0.05 (Kruskal–Wallis test followed by Dunn's multiple comparisons post-hoc test). Significance is shown compared to sham control.