
Image
|
Figure Caption
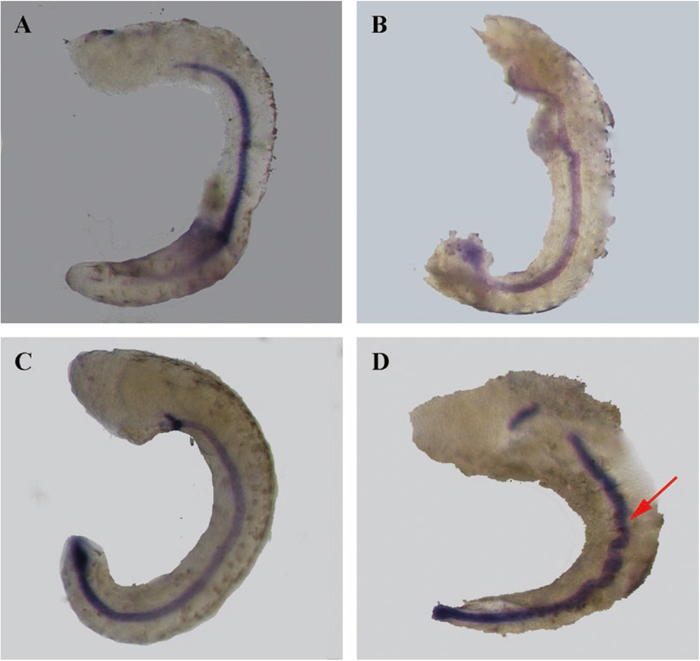
Fig. 5 Tailbud ISH analysis of ntl after overexpression and inhibition of miR-92. About 25 zygotes were treated for each group, and representative embryos are shown. (A) Untreated group. (B) LNA-92 injection group. (C) TE buffer injection group. (D) miR-92 injection group. The red arrow marks the region of ntl expression.
Acknowledgments
This image is the copyrighted work of the attributed author or publisher, and
ZFIN has permission only to display this image to its users.
Additional permissions should be obtained from the applicable author or publisher of the image.
Full text @ Genes Genet. Sys.