IMAGE

Figure 3

ID
ZDB-IMAGE-210206-7
Source
Figures for Noschka et al., 2021
Image
Figure Caption

Figure 3

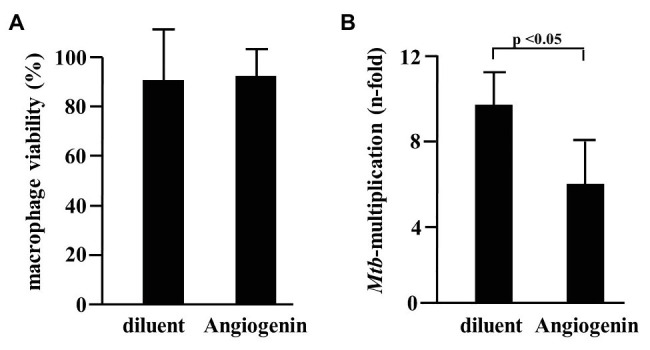
Effect of Angiogenin on macrophage viability and Mtb multiplication. (A) Macrophages were incubated for 24 h with Angiogenin (10 μM, PSL Heidelberg) or diluent. Macrophage viability was quantified using a PrestoBlue™ assay and is given in % of the un-treated sample. Bars represent the mean viability of macrophages (%) ± SD calculated from triplicates of three independent experiments. (B) Macrophages were infected with Mtb, followed by incubation with Angiogenin (10 μM) for 4 days. Lysates were plated on 7H11 agar plates and the number of CFU counted after 21 days of incubation. Mtb-multiplication was calculated by comparison of the CFU determined at d4 and d0. The graph gives the mean values ± SD of n-fold mycobacterial growth as compared to d0 for six independent donors. Statistical analysis was performed using a paired t-test.

Acknowledgments
This image is the copyrighted work of the attributed author or publisher, and ZFIN has permission only to display this image to its users. Additional permissions should be obtained from the applicable author or publisher of the image. Full text @ Front Microbiol