
|
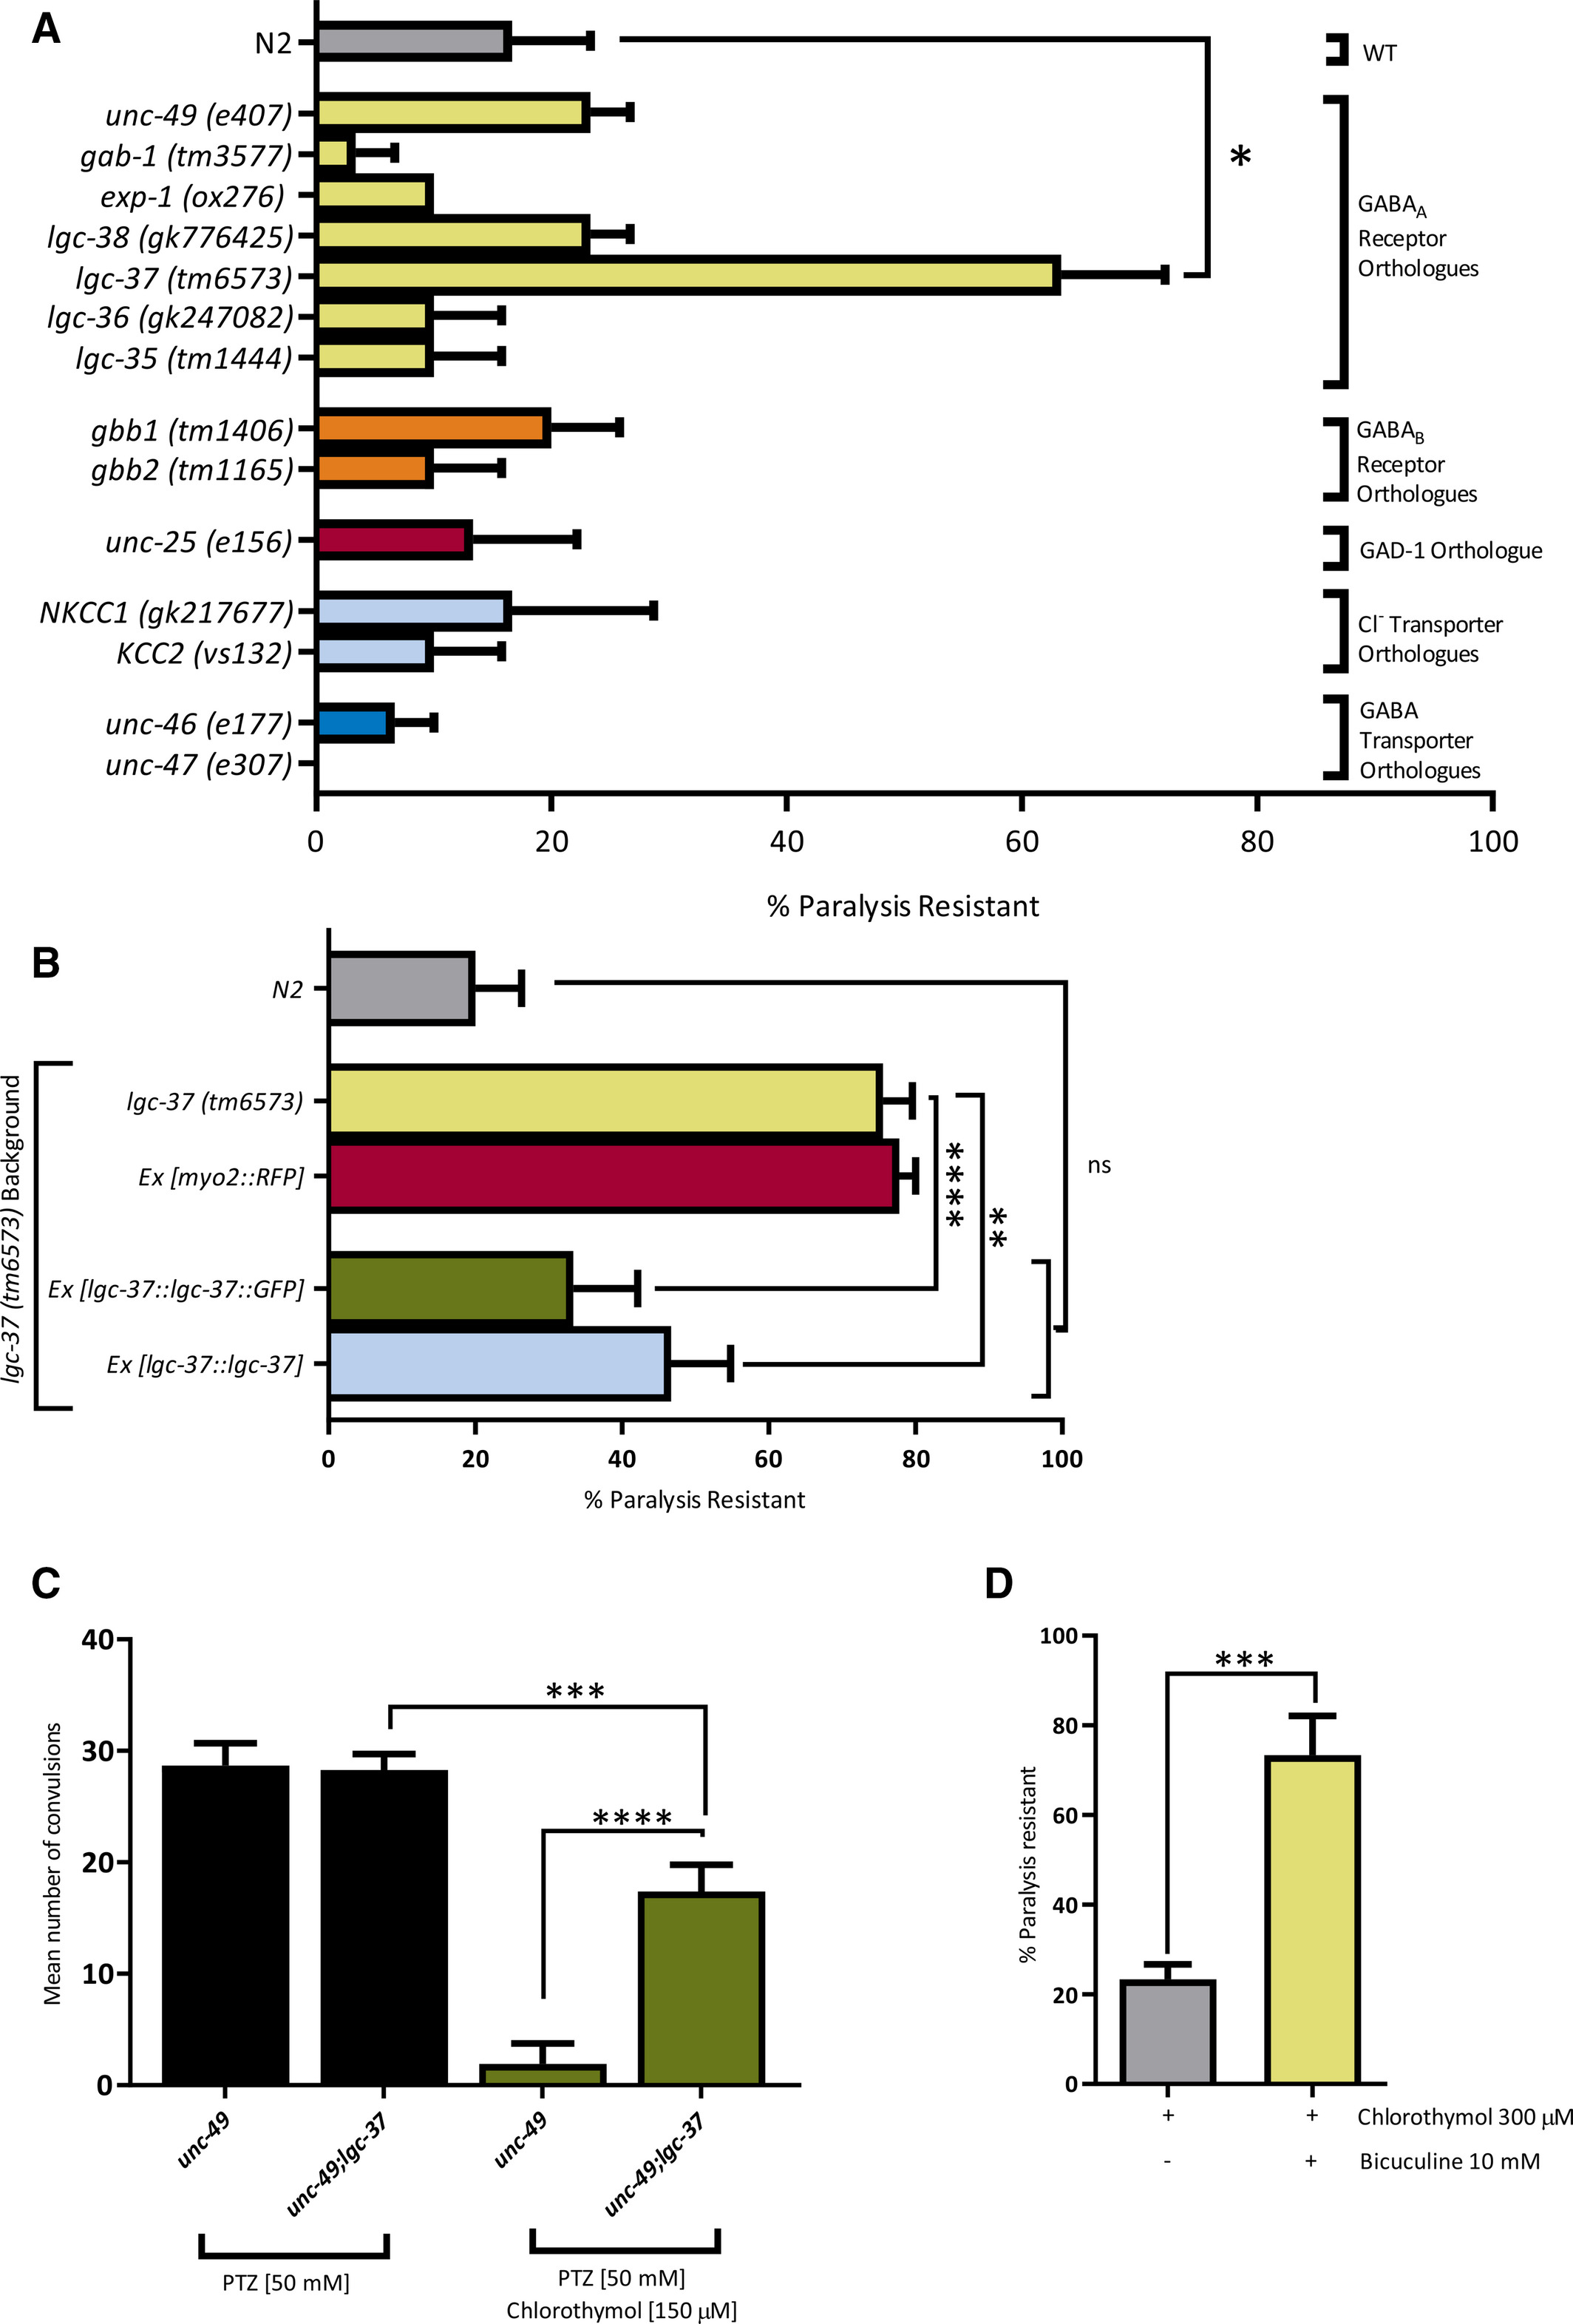
Fig. 3 Chlorothymol acts via the Caenorhabditis elegans γ‐aminobutyric acid type A (GABAA) receptor subunit, LGC‐37. A, Genetic screen for chlorothymol‐resistant mutants. C elegans strains with mutations in genes related to GABA function were incubated for 15 minutes in 300 µmol·L–1 chlorothymol. The proportion of animals that remained paralyzed over a subsequent 30‐second interval was then scored (n = 10 worms per strain, N = 3 independent experiments). The lgc‐37(tm6573) mutant strain was found to be significantly resistant to this paralysis (*P < .05 compared to wild‐type [WT] N2 strain). B, Transgenic expression of wild‐type lgc‐37 DNA constructs reverses chlorothymol resistance in lgc‐37 mutants. Sensitivity to chlorothymol‐induced paralysis in lgc‐37 mutants expressing either green fluorescent protein (GFP)‐tagged (Ex [lgc‐37::lgc‐37::GFP]) or untagged (Ex [lgc‐37::lgc‐37]) lgc‐37 genomic clones was not significantly different from wild‐type N2 controls, whereas expression of the fluorescent marker alone (Ex [myo‐2::RFP]) had no effect (n = 15 worms per strain, N = 3 independent experiments; **P < .01, ****P ≤ .0001 compared to the lgc‐37 strain). ns, not significant; RFP, red fluorescent protein. C, Mutation of lgc‐37 reduces the anticonvulsant effect of chlorothymol. Single mutant unc‐49 and double mutant lgc‐37;unc‐49 strains were compared in the pentylenetetrazol (PTZ) assay of seizure‐related activity. Both strains produced similar levels of PTZ‐induced convulsions, but the anticonvulsant effect of chlorothymol was greatly reduced in lgc‐37;unc‐49 double mutants (n = 10 worms per treatment, N = 3 independent experiments, ***P < .001, ****P ≤ .0001 compared to the unc‐49 strain). D, The competitive GABAA antagonist, bicuculline (10 mmol·L–1) prevents paralysis induced by 300 µmol·L–1 chlorothymol (n = 10 worms per treatment, N = 3 independent experiments, ***P < .001 compared to worms treated with chlorothymol only). Data are shown as mean ± SEM and were analyzed using one‐way analysis of variance with Tukey multiple comparison test (A‐C) or by unpaired t test (D)