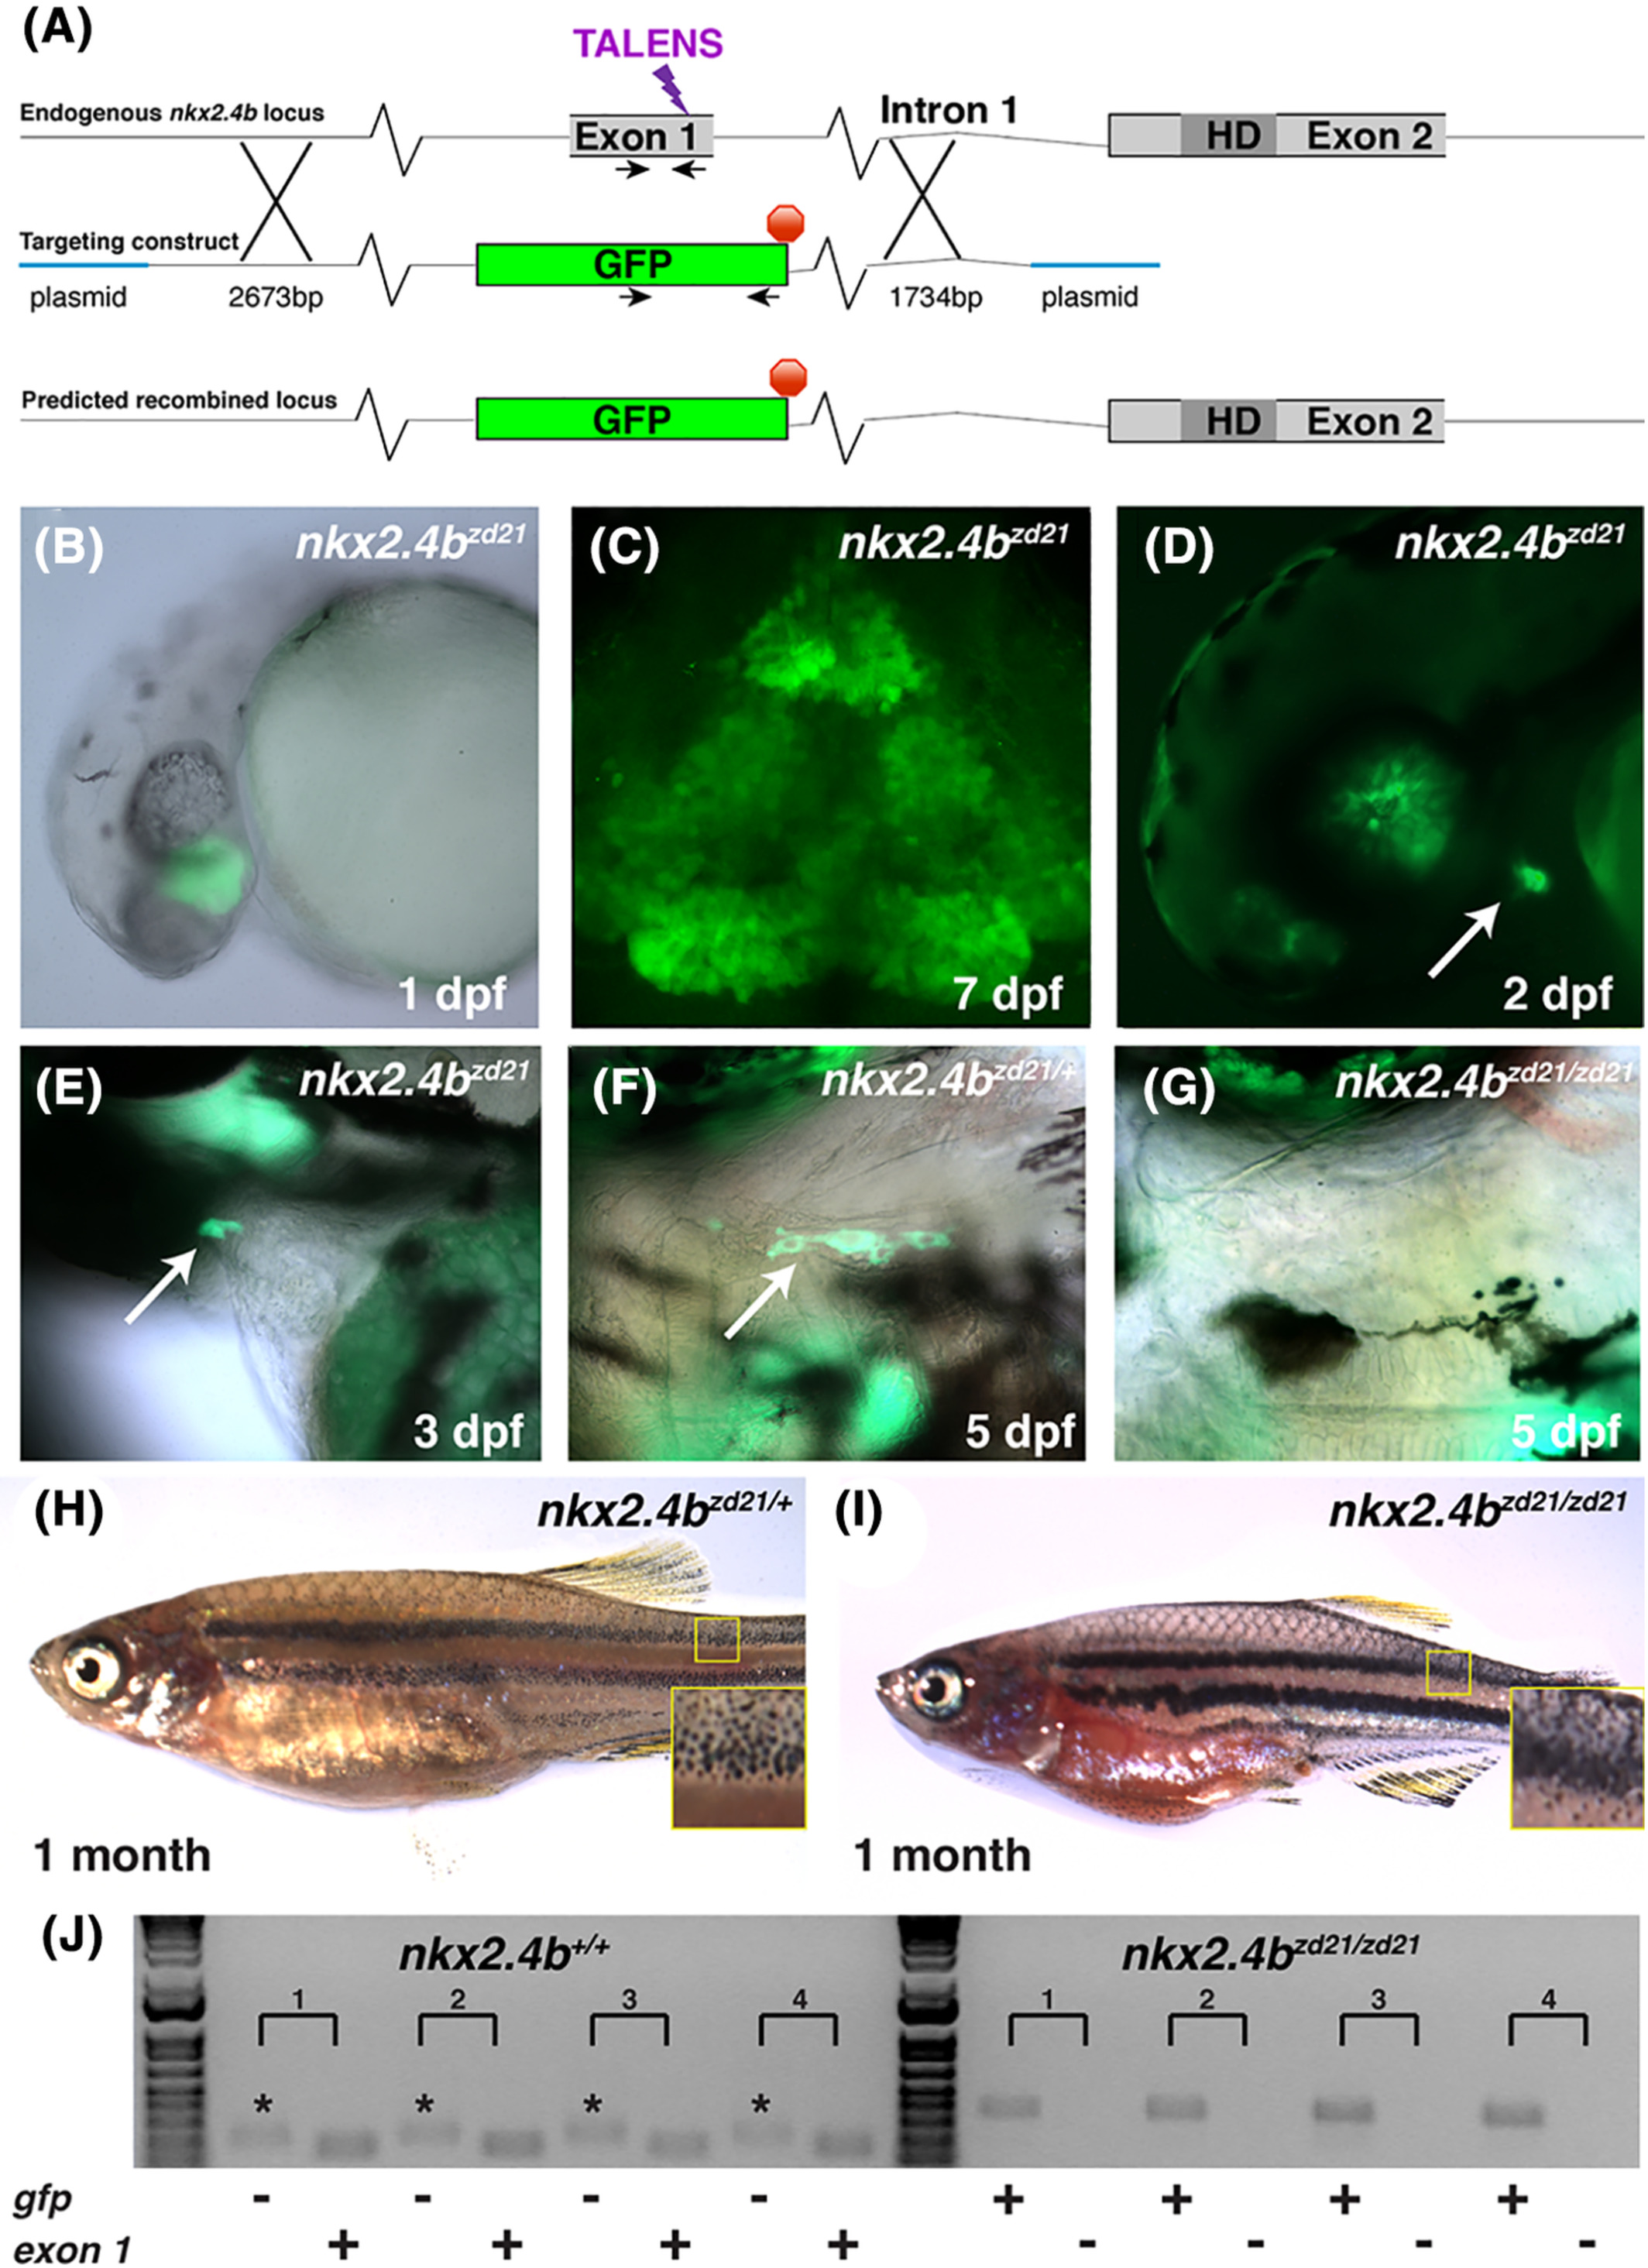
Fig. 3 Targeting a gfp transgene to the nkx2.4b locus. A, Schematic showing the strategy for targeted insertion of a gfp transgene to replace the first exon of nkx2.4b. Genotyping primers for panel (G) are indicated by arrows. B,C, Whole mount image of a live embryo at 1 day postfertilization (dpf), B, and a confocal maximum‐Z projection of a dissected brain (ventral view) at 7 dpf, C, showing GFP expression in the hypothalamus of nkx2.4bzd21 fish. D,E, Live nkx2.4bzd21 embryos at 2 dpf, D, and 3 dpf, E, showing GFP expression in the thyroid primordium (arrows). Expression of GFP in the hypothalamus is obscured by the retinal pigment epithelium in panel D. F,G, Ventral views of live larvae at 5 dpf, showing GFP‐expressing thyroid follicular cells present in the jaw midline of nkx2.4bzd21/+ larvae (arrow in F), but absent in nkx2.4bzd21/zd21 larvae, G. In both genotypes, hypothalamic GFP expression is visible out of the plane of focus. H,I, Gross morphological comparison at 1 month postfertilization showing nkx2.4bzd21/zd21 fish with increased melanophore density and erythema, similar to previously described hypothyroid phenotypes. Yellow boxes indicate magnified regions. J, Genomic polymerase chain reaction analysis of GFP‐negative progeny from a nkx2.4bzd21/+ incross shows the presence of an amplicon for nxk2.4b exon 1 (137 bp product), and no amplicon for gfp (356 bp product, a smaller non‐specific amplicon is marked with asterisk). Analysis of GFP‐positive progeny with hypothyroid morphology shows the absence of the nxk2.4b exon 1 Amplicon and the presence of the gfp amplicon
Image
Figure Caption
Figure Data
Acknowledgments
This image is the copyrighted work of the attributed author or publisher, and
ZFIN has permission only to display this image to its users.
Additional permissions should be obtained from the applicable author or publisher of the image.
Full text @ Dev. Dyn.

