
Figure 4
- ID
- ZDB-IMAGE-210130-21
- Antibodies
- Publication
- Brunal et al., 2021 - Effects of Constitutive and Acute Connexin 36 Deficiency on Brain-Wide Susceptibility to PTZ-Induced Neuronal Hyperactivity
- All Figures
- Figures for Brunal et al., 2021
|
Figure 4
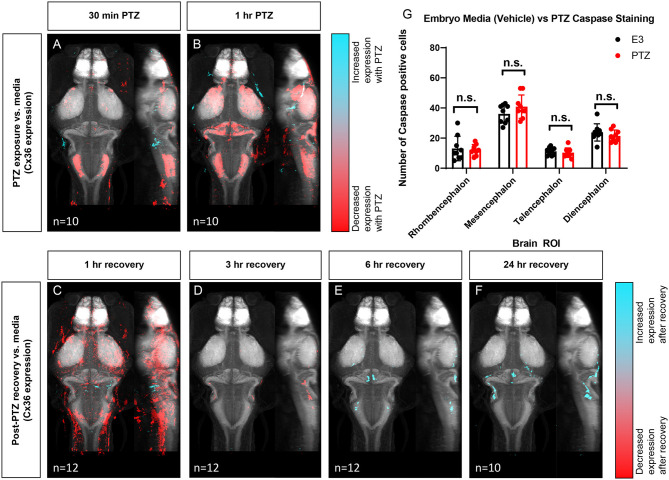
Wild type whole-brain immunostaining Cx36 expression map in E3 vs. PTZ treated zebrafish larvae. Dorsal and lateral view of zebrafish larvae brain. Whole-brain expression of Cx36 using an anti-Cx36 antibody and tERK. Cyan indicates increases in Cx36 labeling in PTZ treated fish, and red indicated decreases in Cx36 labeling in PTZ treated fish.