
Fig. S7
- ID
- ZDB-IMAGE-210128-178
- Publication
- Hui et al., 2014 - Genome wide expression profiling during spinal cord regeneration identifies comprehensive cellular responses in zebrafish
- All Figures
- Figures for Hui et al., 2014
|
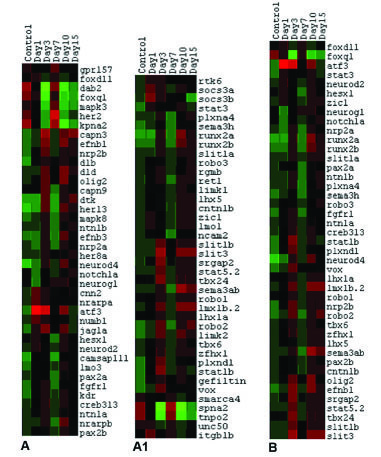
Fig. S7 Differentially expressed genes related to axonogenesis and axonal guidance is represented in two different dendrograms (A and A1) in regenerating zebrafish spinal cord. Dendrogram (B) represents differential expression pattern of transcription factors involved in axonogenesis and axonal guidance. Each horizontal line indicates the expression pattern of each gene and the vertical columns indicate the uninjured control and time points after SCI. The color chart indicates mean fold change of gene expression in each time points. Red and green colors represent increased and decreased expression respectively.