
Figure 3
- ID
- ZDB-IMAGE-210128-107
- Publication
- Takaki et al., 2020 - Schistosoma mansoni Eggs Modulate the Timing of Granuloma Formation to Promote Transmission
- All Figures
- Figures for Takaki et al., 2020
|
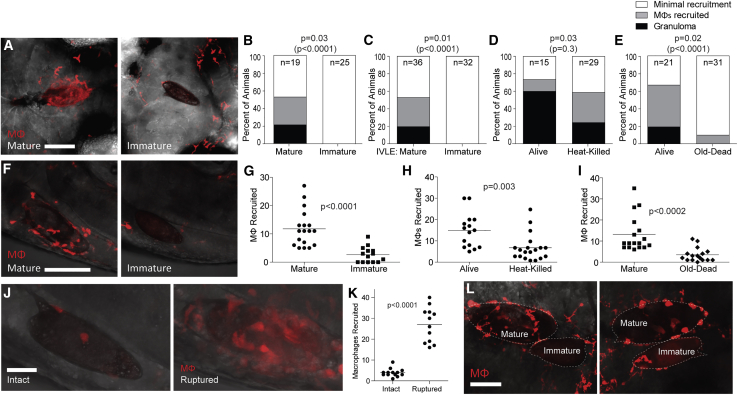
Figure 3
Immature Eggs Do Not Induce Macrophage Recruitment or Granuloma Formation
(A–E) Granuloma formation and macrophage recruitment at 5 dpi comparing mature eggs with (A and B) immature eggs, (C) immature
(B–E) Percent of animals with different levels of macrophage recruitment to the egg.
(F–I) Macrophages recruited to mature eggs at 3 hpi compared with (F and G) immature eggs, (H) heat-killed eggs, and (I) old dead eggs. Representative images in (F), scale bar, 100 μm.
(G–I) Quantification of macrophages recruited.
(J) Confocal images showing macrophage recruitment to intact and mechanically ruptured immature eggs 6 hpi. Scale bar, 25 μm.
(K) Quantification of macrophage recruitment to intact and ruptured immature eggs 6 hpi.
(L) Confocal images of macrophage recruitment 5 dpi to co-implanted mature and immature eggs into the same HBV of two different larvae. Enumeration of recruited macrophages showed 19 and 2 macrophages recruited respectively to the mature and immature egg (left panel), and 23 and 6 macrophages recruited respectively to the mature and immature egg (right panel). Scale bar, 50 μm. (G–I) Horizontal bars, mean values. Statistics, (B–E) Fisher’s exact test comparing the proportion of eggs that induced granuloma formation (black bars), or granuloma formation with macrophage recruitment (black and gray bars combined, in parentheses); (G–I and K) Student’s t test. (B–E) n, number of animals. All experiments performed once, except for (F, G, J, and K), which are representative of two experiments. Also see