
FIGURE 2
- ID
- ZDB-IMAGE-210125-9
- Publication
- Li et al., 2020 - Naringin attenuates cisplatin- and aminoglycoside-induced hair cell injury in the zebrafish lateral line via multiple pathways
- All Figures
- Figures for Li et al., 2020
|
FIGURE 2
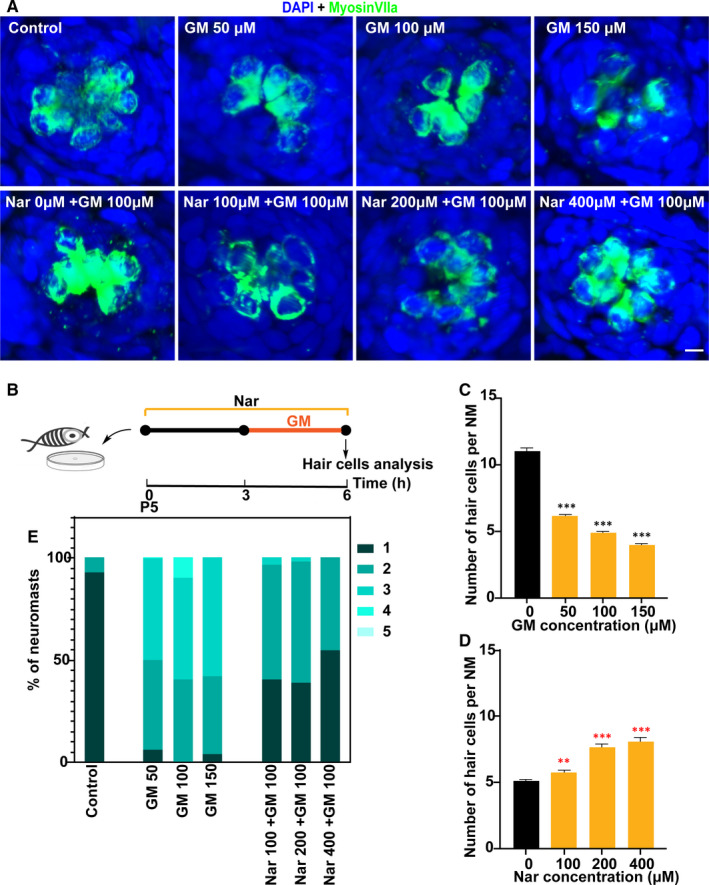
Nar protects against gentamicin ototoxicity. (A) Animals were fixed and immunostained for MyosinVIIa (green) and DAPI. 5 dpf zebrafish were incubated with 0 μmol/L to 150 μmol/L GM for 3 h or pre‐treated with 0 µmol/L to 400 µmol/L of Nar for 3 h and then co‐treated with Nar and GM (100 µmol/L) for 3 h. (B) Diagram of the assay for A. (C and D) Quantification of the number of hair cells (MyosinVIIa+) per neuromast after the different treatments represented as mean ± SEM (n = 10). Control animals were exposed to vehicle alone (DMSO). **