
|
Figure 3
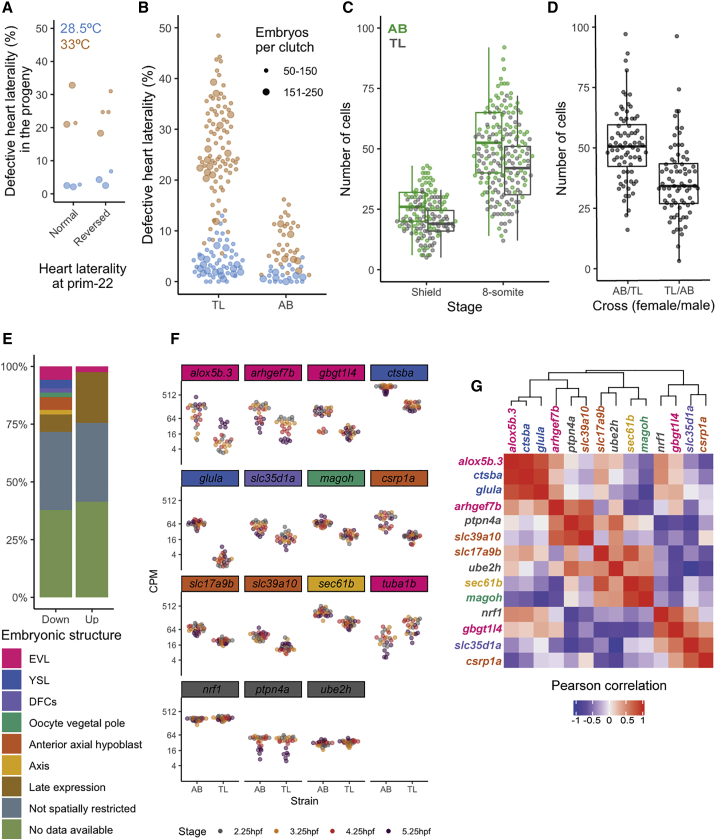
Heart Laterality Defects Are a Stochastic Phenomenon That Is Linked to Maternal Effects
(A) Percentage of embryos with defective heart laterality in the progeny of individuals that showed either normal or reversed heart laterality at prim-22 stage. Incubation temperature 28.5°C (light blue) or 33°C (orange). The smaller points indicate a clutch size ranging of 50–150, and the larger points indicate a range of 151–250.
(B) Percentage of embryos with defective heart laterality per individual clutch analyzed at 28.5°C and 33°C in TL (same data as
(C) Number of DFCs/KV cells at shield and 8-somite stage: for shield stage, n = 78 and 75 for AB and TL, respectively, p < 0.001; for 8-somite stage, n = 94 and 97 AB and TL, respectively, p < 0.001.
(D) KV cell numbers at 8-somite stage in crosses between individual AB and TL males and females, AB/TL versus TL/AB, p < 0.001 (n = 76 for both); AB versus AB/TL, p = 0.461; TL versus TL/AB, p = 0.01; AB versus TL/AB, p < 0.001; TL versus AB/TL, p < 0.001. The boxplots display the median, the hinges represent the first and third quartiles, and the whiskers represent 1.5 of the inter-quartile range from the hinge.
(E) Summary of reported embryonic expression patterns for the down- and upregulated genes.
(F) Expression levels (in counts per million) for genes that are differentially expressed at all stages.
(G) Heatmap showing the pairwise Pearson correlation between the downregulated genes at 2.25 hpf for TL embryos. Color scale at the bottom. For (F) and (G), gene names are color coded to show the embryonic structure in which they are expressed. Three randomly selected genes with similar expression levels were included as an outgroup (gray).
See also