
|
Figure 2
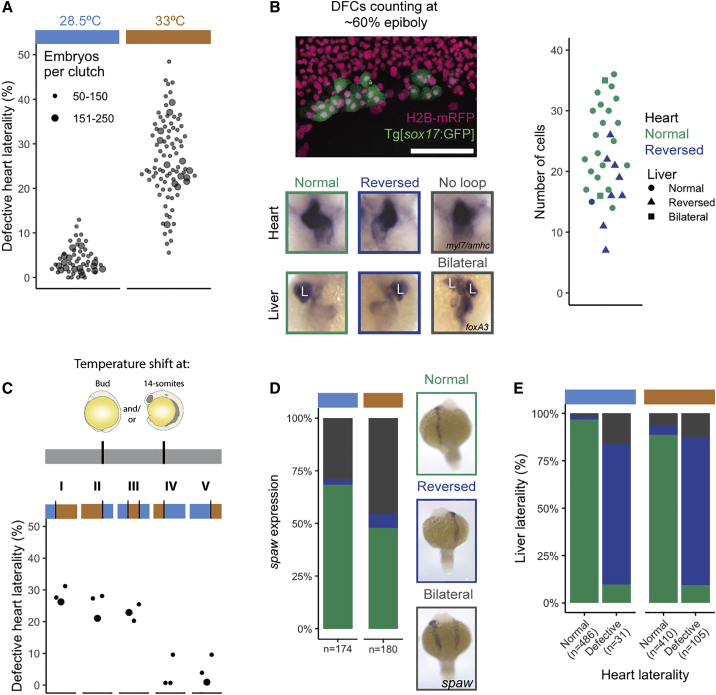
Fluctuations of DFC Numbers Lead to Defects of Organ Laterality
(A) Defective heart laterality percentages observed at prim-22 stage, including reversed and no heart loop observed in embryos incubated at 28.5°C (blue) and 33°C (orange). The column scatterplots show the percentage of embryos with defective heart laterality per individual clutch analyzed at 28.5°C (marked by the horizontal light blue bar) and 33°C (orange bar). The smaller circles indicate a clutch size of 50–150, and the larger circles indicate a range of 151–250 embryos.
(B) Confocal z-projection of the dorsal side of a Tg[
(C) Graphical representation of the different temperature shift treatments: the first third of the gray bar represents the period between 1-cell and bud stage, the second until the 14-somite stage, and the third until the period of collection (prim-22 stage). Circle size and incubation temperature as in (A). Treatments: (I) incubation at 28.5°C until bud stage, change to 33°C; (II) 33°C until 14-somite and then transferred to 28.5°C; (III) 28.5°C until bud stage, shift to 33°C until 14-somite (4.5 h) and then back to 28.5°C; (IV) 33°C until bud stage, change to 28.5°C; and (V) 28.5°C until 14-somite and then transferred to 33°C.
(D) Relative frequency of different
(E) Relative frequency of embryos with normal, reversed, or bilateral liver, separated into embryos with normal or defective heart laterality at long-pec stage (incubated at 28.5°C or 33°C).
See also