
Figure 4
- ID
- ZDB-IMAGE-210117-54
- Publication
- Liu et al., 2021 - Impact of low-frequency coding variants on human facial shape
- All Figures
- Figures for Liu et al., 2021
|
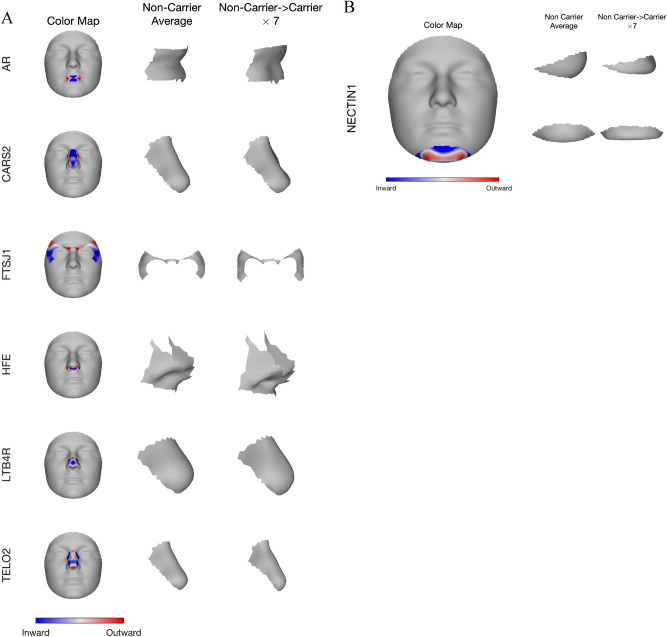
Figure 4
Phenotypic effect of the seven identified genes in their top associated module. Blue and red indicate a local shape depression and protrusion, respectively, due to carrying the low-frequency variants in the gene. (